Portfolio Considerations: Regions, Styles and Sectors
Japan: Upgrading to Overweight
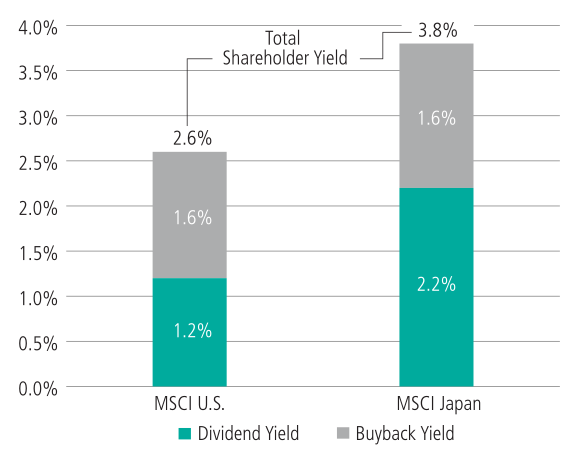
Proliferating green shoots. Japan’s economy continues to gain momentum. Core inflation at 3.3%13 is high enough in our view to invigorate revenue and profit growth, while low unemployment and recent wage increases have boosted spending, which has strengthened for three consecutive quarters.14 Persistently negative real interest rates, amid elevated inflation and gradual rate hikes, are incentivizing corporate borrowing for investment and share buybacks, pushing Japan’s buyback yield to 1.6%, well above that of the U.S. and Europe15 Japanese banks, too, are benefiting as higher long-term yields have increased their desire and ability to lend. These converging factors suggest a robust recovery in domestic earnings, in our view.
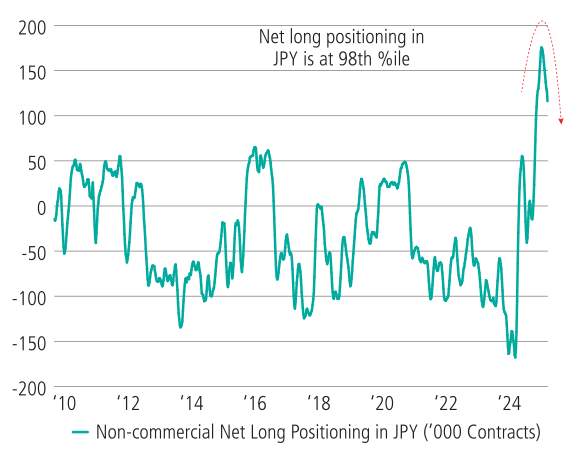
Foreign demand and currency tailwinds. Japanese manufacturers may stand to benefit as Chinese economic growth improves and currency dynamics turn more favorable. After a rally earlier this year, the yen has stabilized and now appears set to weaken as historically extreme bullish bets begin to unwind (left side of figure 3), potentially enhancing the competitiveness and profit margins of Japanese exporters. We believe these currency trends could further improve the earnings prospects of globally exposed Japanese firms and support stronger equity performance over the next 12 - 18 months.
Figure 3: Potential Unwinding of Bullish Bets on the Yen, Along With Attractive Total Shareholder Yields, Could Be Tailwinds for Japanese Equities
Past performance is not indicative of future results. Source: Neuberger Berman and FactSet, data as of July 11, 2025. Nothing herein constitutes a prediction or projection of future events or future market behavior. Due to a variety of factors, actual events or market behavior may differ significantly from any views expressed. For illustrative purposes only.
Attractive valuations and earnings outlook. Despite potentially stronger growth, record corporate buybacks and ongoing shareholder friendly corporate reforms, Japanese equities remain under-owned16 and relatively cheap compared to global peers. For example, as shown on the right side of figure 3, the 3.8% combined dividend-and-buyback yield of the MSCI Japan Index far outpaces the 2.6% total shareholder yield of the MSCI U.S. Index17 Consensus earnings expectations are also low: Analysts estimate that, over the next 12 months, earnings per share for the MSCI Japan Index will grow at 6% versus 12% for the MSCI ACWI.18 Given how highly geared Japanese earnings are to steadily rising global trade volume, we think earnings growth could surprise to the upside.
Europe: Maintaining Overweight
Gathering tailwinds. Successive economic shocks have been rapidly unwinding. First, energy costs have fallen from crisis peaks in 2022, boosting household purchasing power.19 Second, the European Central Bank (ECB), after hiking rates 450 basis points in 14 months, recently delivered its eighth rate cut in the past year; borrowing costs responded, with the eurozone 2-year swap rate falling to 2% from 3.2% a year ago.20 Third, China’s balance-sheet recession has given way to stimulus, fortifying order books at Europe’s industrial firms.
Strengthening corporate earnings. Improvements abroad are translating into stronger profits at home. As China recovers from its slump, European exports of capital goods, luxury products and automobiles are on the rise.21 Fiscal policy also appears supportive of growth, including the European Union’s new Green Deal Industrial Plan and Germany’s €500 billion Climate Transformation Fund; furthermore, the European Commission expects €800 billion in defense investment across member states between 2025 and 2027.22 We believe these various outlays will fortify earnings among Europe’s strongest sectors, such as industrial machinery, construction, green tech and defense manufacturing.
Strong domestic fundamentals. After deleveraging through the 2010s and accumulating excess savings during the pandemic, European consumers look ready to borrow and spend again. In the ECB’s April survey, senior loan officers reported easing credit standards for the first time since 2022,23 along with rebounding demand for mortgage loans. As inflation has cooled and interest rates have declined, consumers are regaining confidence, and forward-looking gauges—such as Germany’s Ifo Business Climate Index and the eurozone’s Sentix Economic Index—have turned positive for the first time in two years.24
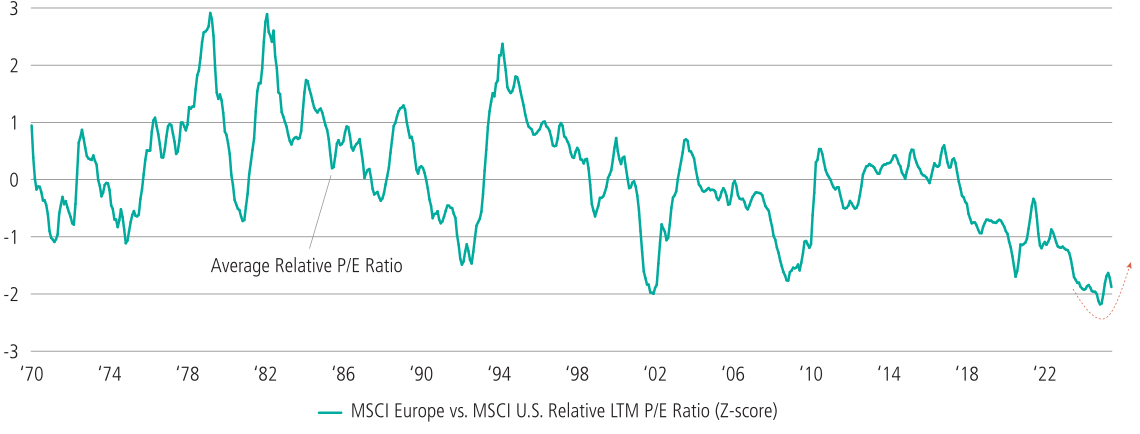
Attractive valuations. From January through mid-July, the MSCI Europe Index advanced 25%, marking its best start since 1998 and outpacing the MSCI ACWI global benchmark by roughly 14 percentage points.25 Yet, despite this outperformance, we believe valuations remain remarkably cheap: Europe offers an average dividend yield near 3%, approximately double the S&P 500’s yield, which we believe could provide a potential income buffer should market volatility pick up again.26. Furthermore, European equities continue to trade about two standard deviations below U.S. markets, nearly the largest relative discount in five decades (as shown in figure 4).
Figure 4: Despite Strong Year-to-Date Returns, European Equities are Still Historically Cheap Relative to U.S. Markets
Past performance is not indicative of future results. Source: Neuberger Berman and FactSet, data as of June 30, 2025. Nothing herein constitutes a prediction or projection of future events or future market behavior. Due to a variety of factors, actual events or market behavior may differ significantly from any views expressed. Investing entails risks, including possible loss of principal. For illustrative purposes only.
China: Maintaining Overweight
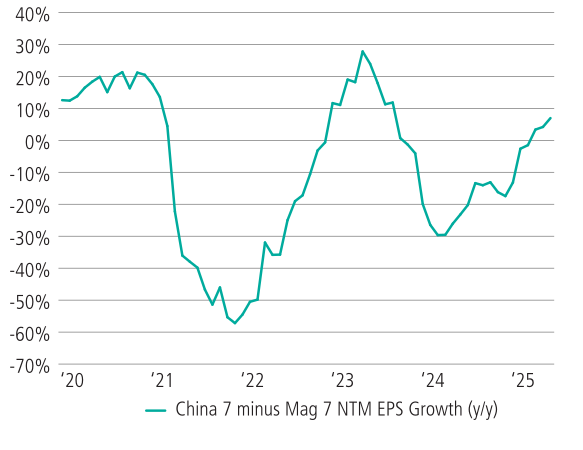
Technology leadership. We believe China’s top technology companies are emerging as global contenders to the U.S. Magnificent 7, reflecting President Xi’s push for innovation in artificial intelligence and robotics.27 Since March 2024, the combined market capitalization of the “China 7” (Alibaba, BYD, Meituan, Netease, PDD, Tencent and Xiaomi) has soared 54%. While these companies now make up 43% of the MSCI China Index, their market cap measures just one-ninth of the Mag 7’s.28 As shown on the left side of figure 5, next-12-month earnings for the China 7 are expected to grow faster than the earnings of the Mag 7, yet are collectively priced at only 11 times forward earnings vs. 28 times for the Mag 7.29 We believe this yawning gap suggests considerable room for further upside.
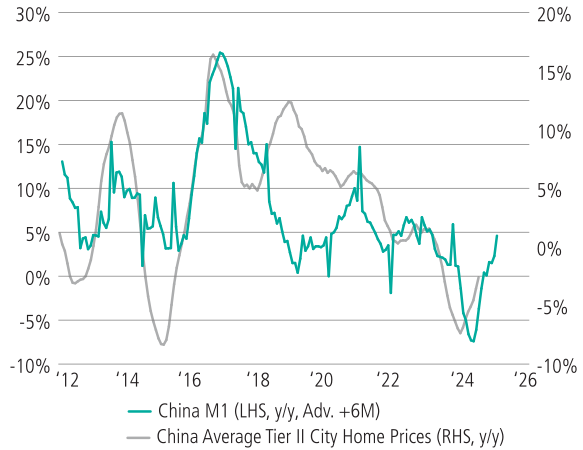
Figure 5: Earnings for the “China 7” Are Expected to Grow Faster Than Those for the Mag 7, And China’s Beleaguered Housing Sector Is Beginning to Stabilize
Past performance is not indicative of future results. Source: Neuberger Berman Research and FactSet, data as of June 30, 2025. Nothing herein constitutes a prediction or projection of future events or future market behavior. Due to a variety of factors, actual events or market behavior may differ significantly from any views expressed. Investing entails risks, including possible loss of principal. For illustrative purposes only.
Cyclical acceleration. Tech isn’t the whole story in China. Broadening drivers of economic growth have begun to widen equity market breadth, and leading names have recently included financial and consumer stocks. Additionally, the Chinese housing sector has begun to stabilize: In recent months, properties in Tier 1 and Tier 2 cities have cleared title faster; transaction volumes have ticked up; and the recent decline in home prices has slowed (as shown on the right side of figure 5), which we find to be consistent with recent re-accelerating growth in the money supply30 We believe these trends point to an early-stage housing rebound that, in turn, may encourage higher spending, boost retail activity and continue to extend Chinese stock market leadership beyond the tech sector.
Supportive policy. China is in both fiscal and monetary loosening mode.31 Its central bank has cut lending rates and reserve requirements, while regulators have sought to bolster the banking system, including a RMB 500 billion recapitalization for state-owned commercial banks.32 These moves, aided by recent weakness in the U.S. dollar, have helped Chinese policymakers ease more aggressively while supporting their currency. Early evidence suggests to us that the stimulus is taking hold as key liquidity indicators have turned upward: Growth in both the money supply and bank credit have risen—green shoots, perhaps, of a new credit cycle—and shares of Chinese banks have recently climbed to multi-year highs33 On the fiscal side, infrastructure spending and special bond issuance have also ramped up, and officials appear resolved to unleash even more stimulus to meet their 5% GDP growth target.34 We believe these policy tailwinds reinforce the case for China’s cyclical renewal over the next six to 18 months.
India: Maintaining Underweight
Faltering economic growth. Recent income-tax relief for the middle class has failed to boost consumption—only a small fraction of households actually pay income tax—and many lower-income families have been cutting back on essentials amid higher food prices.35 Analysts now expect India’s real GDP growth to moderate to the mid-6% range in 2025, down from about 9% last year.36
Tight financial conditions. Policy rates remain elevated, and with inflation falling faster than the central bank has eased, real borrowing costs have spiked to roughly 15-year highs.37 Liquidity is also constrained as the central bank has sold foreign currency reserves to defend the rupee, reducing its availability.38 As a result, bank credit growth and money supply are nearly flat in real terms—a negative credit impulse that, we believe, signals a waning appetite for capex investment and slowing business activity.39
Stretched valuations. Despite the challenges listed above, Indian equities continue to trade at rich valuations, both in absolute terms and relative to peers. The MSCI India Index now trades at nearly 23 times forward 12-month earnings—about two standard deviations higher than the historical mean40—placing India among the most expensive markets in the world. And even after a recent market pullback, we believe current valuations still leave little room for error, and that any earnings disappointments could trigger further declines.
Overweighting Value Versus Growth
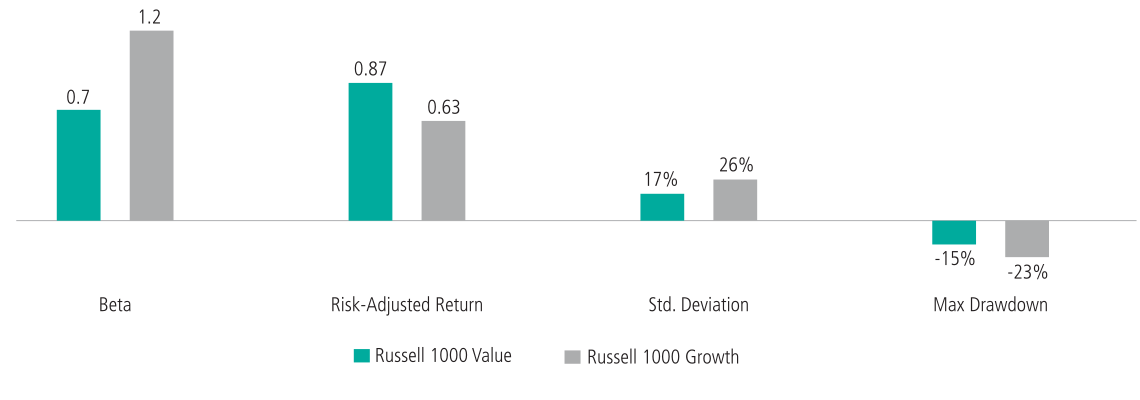
While mega-cap growth stocks continue to steal headlines, value investors have enjoyed 35% - 50% better risk-adjusted returns than growth investors in the past 12 months, and especially in 2025. As shown in figure 6, the Russell 1000 Value Index, which has a beta of 0.7, has suffered far smaller drawdowns than the Russell 1000 Growth Index, which has a beta of 1.2 and 50% higher volatility.
Figure 6: Value Stocks Have Offered Superior Risk-Adjusted Returns Compared To Growth Stocks Over the Last 12 Months
Past performance is not indicative of future results. Source: Neuberger Berman and FactSet, data as of June 30, 2025. Nothing herein constitutes a prediction or projection of future events or future market behavior. Due to a variety of factors, actual events or market behavior may differ significantly from any views expressed. Investing entails risks, including possible loss of principal. For illustrative purposes only.
We expect more frequent bouts of volatility as the economy slows, further supporting our lower-beta value thesis. Unlike in many previous cycles, we think the current slowdown will be led by the services sector rather than by the industrially oriented goods sector, which we expect to continue to rebound. Given that value tends to be more geared toward industrial output than growth, we expect value to outperform growth as global industrial production continues to gain momentum after a slump that lasted well over two years.
Overweighting Small Caps Versus Large Caps
Over a year ago, we made the case for a long-awaited revival in small caps, based on a projected pick-up in global industrial production and capital expenditures. (For more details, see our 2Q 2024 Equity Market Outlook.) While admittedly early, we see signs that a change in leadership may finally be gaining momentum.
Since early April, the smallest 1000 stocks within Russell 2000 Index have roundly outperformed all nine categories across the investment style box.41 While by no means do we recommend chasing microcap performance, their remarkable 36% returns since April 8, versus 25% for the S&P 500 Index, suggest to us that investors’ overall appetite for risk may be increasing.42
Furthermore, we believe that small-cap earnings, which tend to be strongly geared to global industrial output, should benefit as industrial momentum continues to strengthen. And while small cap returns tend to fluctuate more than large cap returns during market corrections, favorable policy measures and lower interest rates could mitigate those impacts, in our view.
Utilities: Downgrading to Underweight from Overweight
Utility stocks have outperformed in 2025 and over the last 12 months, a strong run driven by the sector’s defensive appeal and exposure to the AI theme. As concerns about tariff impacts, higher inflation and slowing economic growth took hold, utilities’ stable cash flows and dividends attracted investors rotating out of riskier assets.
Meanwhile, utility companies have been investing heavily in grid upgrades and renewable infrastructure—the sector’s largest capital expenditure cycle in decades—which we expect will likely put pressure on free cash flows. And while utility stocks have benefited from the narrative that power-hungry data centers (the backbones of the AI boom) will significantly boost energy demand, many analysts now believe the market has priced in those projections. With the sector trading at 18 times forward earnings, we tend to agree.43
Should industrial momentum continue to pick up as we expect, we believe investors will likely turn their attention away from defensive sectors potentially constrained by macro and regulatory forces. In this context, we believe continuing to overweight utilities risks locking in subpar returns while missing broader opportunities across other sectors and styles.