In Short
- October was a strong month for equity markets, with the S&P 500 up over 2%, though the positive return was driven by less than 50% of the index.
- While the U.S. government shutdown caused delays in key data releases, the Federal Reserve implemented an interest rate cut in October; a further reduction in December is not a foregone conclusion.
- With AI momentum expected to continue, performance concentration within U.S. equities may provide another reason for diversification to other segments of the market.
The Month in Markets
Investors and trick-or-treaters alike were in for a treat in October. Investors saw further market gains, with the S&P 500 up 2.3%, the Russell 2000 rising 1.8%, the ACWI ex-U.S. gaining 2.0% and MSCI Emerging Markets advancing 4.2%, despite a few “tricks” like the longest government shutdown in U.S. history and rising trade tensions between the U.S. and China. Though the government shutdown caused delays in key data releases, including the nonfarm payrolls report, the Federal Reserve implemented a 25-basis-point interest rate cut in October based on available indicators. The central bank also announced that it would end quantitative tightening on December 1 after more than $2 trillion in balance sheet reductions. Following the rate cut, the Fed’s benchmark is at a range of 3.75 – 4%, down from the peak of around 5.4% that the central bank maintained for much of last year.
An interest rate cut was expected, but Fed Chair Jerome Powell’s more hawkish tone surprised markets. Before the October meeting, odds of a December rate reduction were above 90%, but those odds moved closer to 65% when Powell made it clear that a December cut was not a foregone conclusion. That said, in terms of investment implications, we still expect modestly lower interest rates plus improving growth to prove a tailwind for risk assets moving into 2026.
Earlier in the month, escalating trade tensions between the U.S. and China caused the S&P 500 to see its largest daily declines since the Liberation Day announcements in April, with its worst single-day return for the month occurring on October 10 (-2.7%). However, improvements in trade discussions ultimately led to President Donald Trump and Chinese President Xi Jinping meeting late in the month to deliver a widely expected trade truce, in which the U.S. agreed to cut existing tariffs on China by 10% in exchange for China pledging to work with the U.S. on issues with fentanyl. Positive trade talks and a Fed cut coupled with a stronger-than-expected start to Q3 earnings season were tailwinds for global risk assets in October, with the S&P 500 hitting a fresh all-time high toward the end of the month.
Focusing on Concentration
With so much chatter around rising valuations of big tech companies, massive AI capital expenditure and the increasing circularity of the AI ecosystem, it is important to recognize the expanding impact of mega-cap companies on the broader index. Within the S&P 500, Information Technology is the largest sector, making up over 36% of the index as of the end of October. The tech sector is larger than the next three largest sectors combined: Financials, Consumer Discretionary and Communication Services (33.5% in total). Recently, Nvidia, the largest company within the S&P 500, became the first publicly traded company to be valued at $5 trillion; this company alone makes up nearly 8.5% of the index, which is more concentrated than the weights of Alphabet and Meta combined (7.5%).
Big bets on artificial intelligence productivity gains have helped buoy lofty prices, but earnings have also continued to positively surprise. With third-quarter earnings season in full swing—the S&P 500 is on track for its fourth consecutive quarter of double-digit blended earnings growth—we saw big tech earnings highlighting the elevated capex levels seen as crucial for the broader AI trade. Coming into the quarter, the Information Technology sector was expected to see a blended earnings growth of about 15.5%; by the end of October, reported growth was upwards of 25%. Further highlighting the impact of these companies, the top four contributors to the increase in the earnings growth rate for the S&P 500 in October were Magnificent 7 companies1 (Alphabet, Amazon, Microsoft and Apple), while the largest detractor from the earnings growth rate over this period was also a Mag 7 company (Meta).
This phenomenon highlights the impact of market concentration and the increasing importance of diversification beyond U.S. large-cap stocks in investment portfolios. In October, we saw an interesting trend: The average stock in the S&P 500 had a negative return, but the broader index was positive. In fact, nearly 60% of the index saw a negative monthly return in October, and yet the index was up over 2%. There is even dispersion within the Magnificent 7, which helped drive October’s positive return (Nvidia, Apple, Amazon, Alphabet), as Meta was the index’s single largest detractor from performance.
S&P 500 Index Returns vs. Average Stock Returns by Month
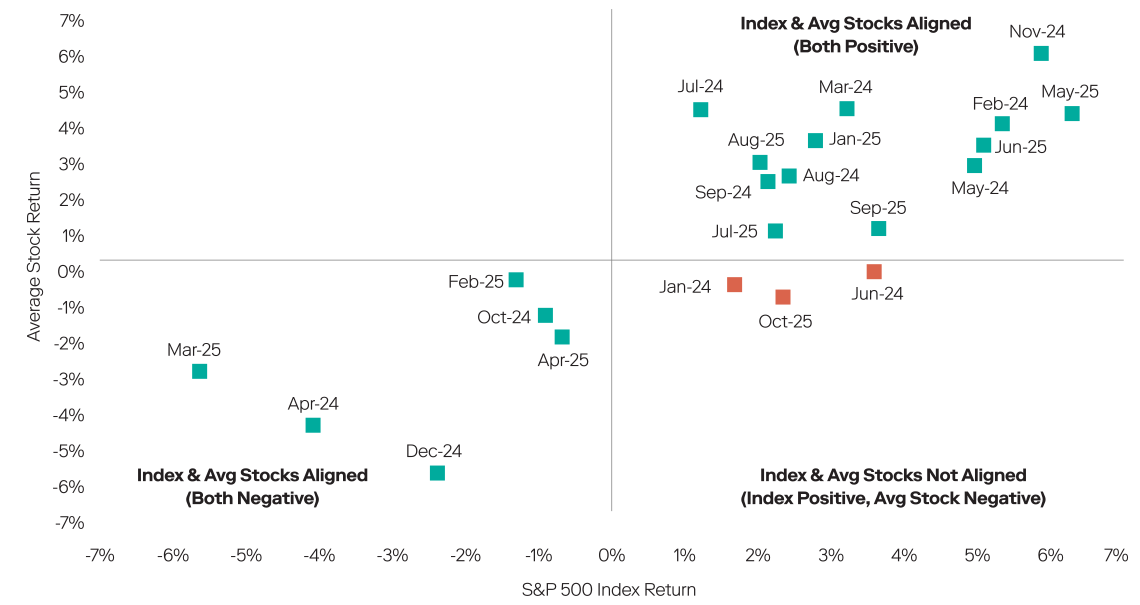
Source: Bloomberg, as of October 2025.
Exposure to U.S. large cap stocks remains important and has worked well for many investors, with the S&P 500 currently on track to enjoy three consecutive years of double-digit returns. We continue to recommend having exposure to U.S. stocks, with AI in the driver’s seat and a supportive macro backdrop, but also see attractive opportunities in other segments of the market; for example, we expect a softer dollar to support non-U.S. equities and see opportunities in fixed income to lengthen duration. Fixed income, in particular, can serve as the ballast of a multi-asset portfolio, providing stability, income and diversification. As investors move toward the end of the year and look for opportunities to harvest losses, it could be a good time to revisit long-term strategic asset allocations and consider whether current targets reflect a risk/return profile aligned with personal investment goals and objectives.
U.S. Fixed Income Returns at Highest Point in Over Four Years
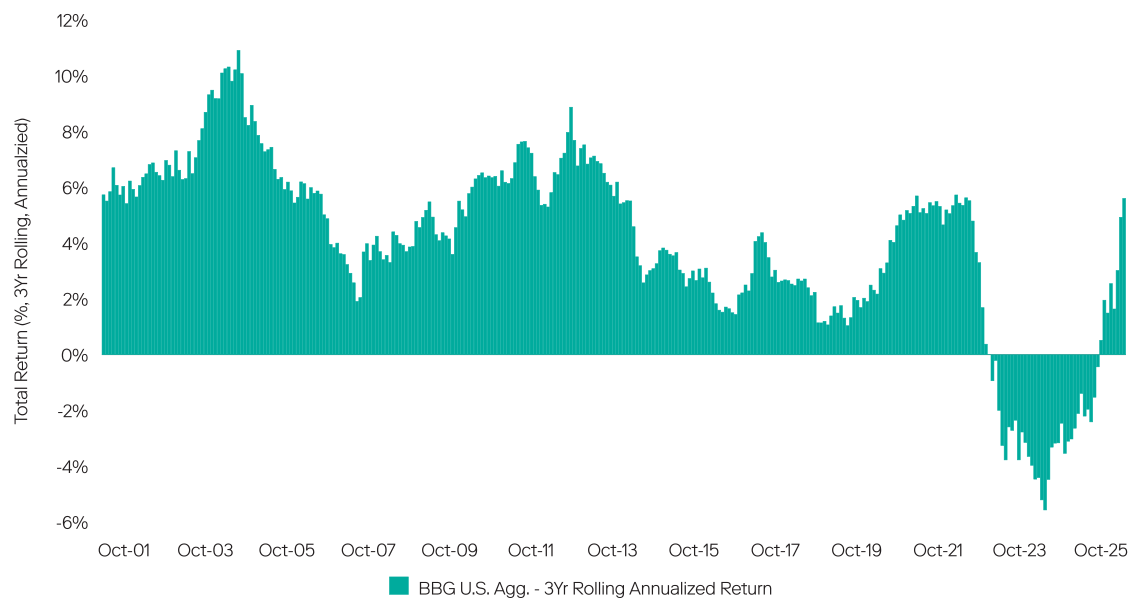
Source: Bloomberg, as of October 2025, represented by the Bloomberg U.S. Aggregate Index.
Portfolio Implications
Equities were broadly higher, led by growth stocks and emerging market equities, in part due to positive trade talks between the U.S. and China. We maintain an overweight to small and midcaps on the expectation these companies will continue to benefit from rate cuts, deregulation and pro-business policies. Developed non-U.S. equities should continue to benefit from the rotation as well, although there are opportunities to be more tactical on signs of economic divergence. Otherwise, we maintain an “at-target” view across equities. Admittedly, short-term political volatility may create some pressure. However, any larger pullbacks (10% or more) could be an appropriate trigger to add risk, especially for those holding excess cash. In this more challenging environment, we favor employing active management to select companies with high earnings visibility.
Fixed Income moved higher as yields fell. We remain constructive on investment-grade fixed income, but see opportunities to deploy cash tactically, adding and/or shortening duration based on the movement of rates. While geopolitical and tariff risks persist, we maintain that the worst-case scenarios seem less likely, and outcome should not significantly affect credit markets. Further expected cuts of U.S. policy rates by the Fed should continue to boost performance of U.S. fixed income, but the One Big Beautiful Bill Act has added some uncertainty, as investors may continue to demand higher term premiums to compensate for the risk of holding long-term government bonds at a time when large federal deficits are creating uncertainty about future economic stability. Multi-sector bond funds may be an appropriate vehicle to consider given the levers a manager can opportunistically pull across sector, duration profile and region.
With a fading liquidity drought and a recent pickup in mergers and acquisitions and other deal activity, we believe significant opportunities still exist within Private Markets, as investors should expect new buyout activity and an unlocking of distributions. That said, liquidity and capital solutions providers will likely remain important to work through the substantial backlog of legacy investments. As a result, we continue to see compelling opportunities across secondaries, midlife co-investments and capital solutions. We are cautious on core private real estate, but this is offset by what we see as abundant market-dislocation opportunities in the value-add and opportunistic sectors and, particularly, real estate secondaries. Neuberger’s deep relationships and unique position within the private equity ecosystem have translated into record levels of deal flow across our platform.
Index Returns as of October 2025
| Public Equity | Traditional Private Equity | Evergreen Private Equity | |
|---|---|---|---|
| Oct-25 | 3M | YTD | |
| Equities | |||
| Major U.S. Indices | |||
| S&P 500 Index | 2.3% | 8.2% | 17.5% |
| Nasdaq Composite | 4.7% | 12.5% | 23.5% |
| Dow Jones | 2.6% | 8.2% | 13.3% |
| U.S. Size Indices | |||
| Large Cap | 2.2% | 7.9% | 17.1% |
| Mid Cap | -0.8% | 2.6% | 9.5% |
| Small Cap | 1.8% | 12.5% | 12.4% |
| All Cap | 2.1% | 8.1% | 16.8% |
| U.S. Style Indices | |||
| All Cap Growth | 3.5% | 10.2% | 20.9% |
| All Cap Value | 0.4% | 5.4% | 12.0% |
| Global Equity Indices | |||
| ACWI | 2.2% | 8.6% | 21.1% |
| ACWI ex US | 2.0% | 9.4% | 28.6% |
| DM Non-U.S. Equities | 1.2% | 7.6% | 27.2% |
| EM Equities | 4.2% | 13.3% | 33.6% |
| Portfolios | |||
| 50/50 Portfolio | 1.8% | 6.4% | 10.7% |
| Public Equity | Traditional Private Equity | Evergreen Private Equity | |
|---|---|---|---|
| Oct-25 | 3M | YTD | |
| Fixed Income Currencies & Commodities | |||
| Major U.S. Indices | |||
| Cash | 0.3% | 1.1% | 3.5% |
| U.S. Aggregate | 0.6% | 2.9% | 6.8% |
| Munis | 1.2% | 4.5% | 3.9% |
| U.S. Corporates | |||
| Investment Grade | 0.4% | 2.9% | 7.3% |
| High Yield | 0.2% | 2.3% | 7.4% |
| Short Duration (1.9 Yrs) | 0.3% | 1.6% | 4.5% |
| Long Duration (12.8 Yrs) | 0.9% | 4.8% | 7.6% |
| Global Fixed Income Indices | |||
| Global Aggregate | -0.3% | 1.9% | 7.6% |
| EMD Corporates | 0.4% | 2.7% | 7.9% |
| Commodities | |||
| Commodities | 2.9% | 7.1% | 12.5% |
| U.S. Treasury Yields | |||
| U.S. 10-Year Yield | -0.1% | -0.3% | -0.5% |
| U.S. 2-Year Yield | 0.0% | -0.4% | -0.7% |
| FX | |||
| U.S. Dollar | 2.1% | -0.2% | -8.0% |
Source: Bloomberg, Total returns as of October 31, 2025. S&P 500 Index is represented by S&P 500 Total Return Index. Nasdaq Composite NASDAQ-Composite Total Return Index. Dow Jones is represented by Dow Jones Industrial Average TR. Large Cap is represented by Russell 1000 Total Return Index. Mid Cap is represented by Russell Midcap Index Total Return. Small Cap is represented by Russell 2000 Total Return Index. All Cap is represented by Russell 3000 Total Return Index. Large Cap Growth is represented by Russell 1000 Growth Total Return. Large Cap Value is represented by Russell 1000 Value Index Total Return. Small Cap Growth is represented by Russell 2000 Growth Total Return. Small Cap Value is represented by Russell 2000 Value Total Return. ACWI is represented by MSCI ACWI Net Total Return USD Index. ACWI ex U.S. is represented by MSCI ACWI ex USA Net Total Return USD Index. DM Non-U.S. Equities is represented by MSCI Daily TR Gross EAFE USD. EM Equities is represented by MSCI Daily TR Gross EM USD. Cash is represented by ICE BofA U.S. 3-Month Treasury Bill Index. U.S. Aggregate is represented by Bloomberg U.S. Agg Total Return Value Unhedged USD. Munis is represented by Bloomberg Municipal Bond Index Total Return Index Value Unhedged USD. Munis Short Duration is represented by Bloomberg Municipal Bond: Muni Short (1-5) Total Return Unhedged USD. Munis Intermediate Duration is represented by Bloomberg Municipal Bond: Muni Intermediate (5-10) TR Unhedged USD. Investment Grade is represented by Bloomberg U.S. Corporate Total Return Value Unhedged USD. High Yield is represented by Bloomberg US High Yield BB/B 2% Issuer Cap Total Return Index Value Unhedged USD. Short Duration is represented by Bloomberg U.S. Agg 1-3 Year Total Return Value Unhedged USD. Long Duration is represented by Bloomberg U.S. Agg 10+ Year Total Return Value Unhedged USD. Global Aggregate is represented by Bloomberg Global-Aggregate Total Return Index Value Unhedged USD. EMD Corporates is represented by J.P. Morgan Corporate EMBI Diversified Composite Index Level. EMD Sovereigns – USD is represented by J.P. Morgan EMBI Global Diversified Composite. Commodities is represented by Bloomberg Commodity Index Total Return. Commodities ex Energy is represented by Bloomberg Ex-Energy Subindex Total Return. U.S. 10-Year Yield is represented by U.S. Generic Govt 10 Yr.