China: A Two-Speed Economy; Remain Overweight
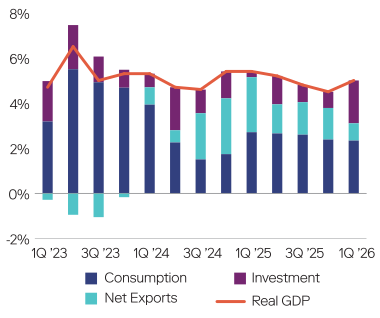
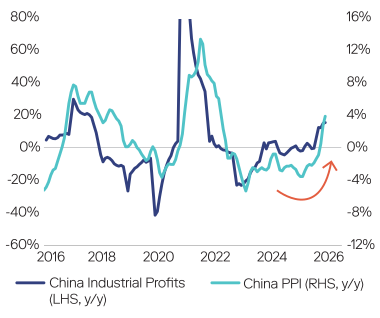
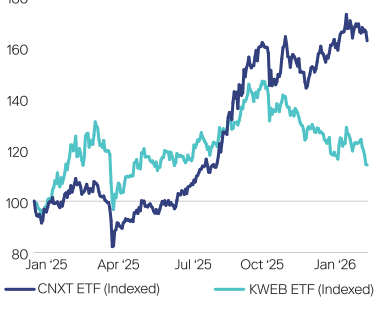
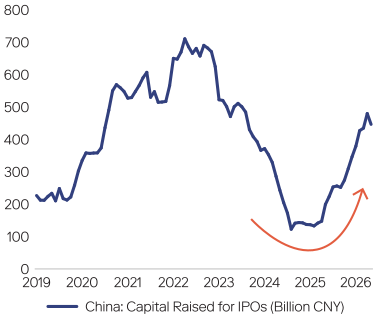
We remain overweight Chinese equities even as a lackluster housing recovery has weighed on consumption. Investment—particularly in technology and AI—has been offsetting soft domestic demand by contributing 1.9 pp to GDP growth in 1Q 2026, up from 0.7 pp in 4Q 2025 (top left chart). China’s two-speed economy is visible in markets: Onshore advanced-manufacturing names (proxied by the CNXT ETF) have been outperforming consumer-facing internet platforms (tracked by the KWEB ETF), as shown in the bottom left chart. Furthermore, “anti-involution” policies, which aim to reduce excess capacity, have pushed PPI higher, with revenue and profit growth potentially to follow (top right chart), while a revival in IPO activity has reinforced investor sentiment (bottom right chart). Despite recent softer-than-expected activity data, we believe policy direction, inflecting profits and further tech self-reliance could be multi-year tailwinds as AI diffuses into manufacturing and the broader economy.
Investment’s Contribution to GDP Growth Is Rising
Reflation in China May Support Sales and Profits Growth
AI-Buildout Beneficiaries Have Been Outpacing Consumer-Facing Internet Names
A Pickup in Public Offerings Is Boosting Market Sentiment
Source: Neuberger, Macrobond and FactSet. Data as of July 3, 2026. The CNXT ETF tracks the ChiNext CNY Index, a market cap-weighted index of 100 small- and medium-size companies traded on the SME Board and ChiNext Board of the Shenzhen Stock Exchange. The KWEB ETF tracks the CSI Overseas China Internet index, a market cap-weighted index composed of overseas-listed Chinese Internet companies. IPO data shown as a trailing 12-month sum. Past performance is not indicative of future results. For illustrative and discussion purposes only. Nothing herein constitutes a prediction or projection of future events or future market behavior. Due to a variety of factors, actual events or market behavior may differ significantly from any views expressed.
Europe: Softening Growth; Reducing Allocation Further
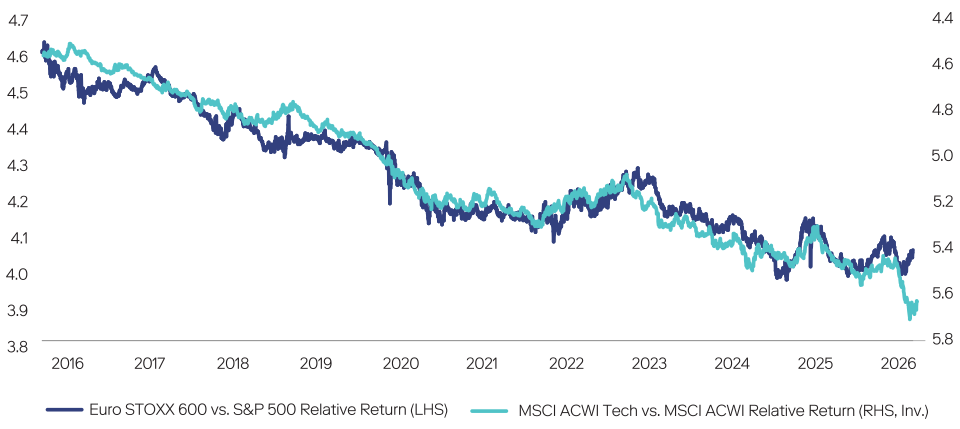
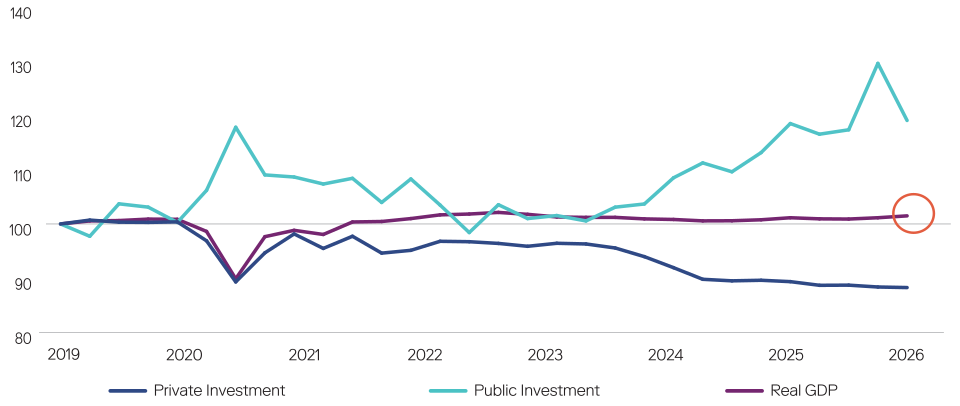
We are extending last quarter's downgrade on European equities. While the reopening of the Strait of Hormuz may offer Europe a near-term reprieve, our list of concerns on the region remains: Gas storage sits below average; real money-supply growth has rolled over; and the ECB could decide to hike into economic weakness. Crucially, being overweight Europe versus the U.S. is an implicit short on the Tech sector, given that the Euro STOXX 600 Index's relative performance has tracked the inverse of tech’s outperformance (top chart). Though positive earnings revisions have been rising, broader economic markers appear to be softening, which typically doesn’t bode well for cyclicals. And while much has been made of Europe’s fiscal plan, which should predominantly benefit Germany, we believe the bar is low and the track record is poor: German real GDP has grown only 1.5% cumulatively since 2019, with public investment doing the heavy lifting as private investment has stagnated (bottom chart).
Overweighting Europe (vs. the U.S.) Has Become an Implicit Bet Against the Technology Sector
A Combination of Heavy Public and Minimal Private Investment Has Delivered Weak Economic Growth in Germany
German Real Economic Growth (Indexed 2019 = 100)
Source: Neuberger and FactSet. Data as of July 2, 2026. Past performance is not indicative of future results. For illustrative and discussion purposes only. Nothing herein constitutes a prediction or projection of future events or future market behavior. Due to a variety of factors, actual events or market behavior may differ significantly from any views expressed.
India: Broad-Based Sell-Off Into Weakening Earnings; Downgrade to Neutral
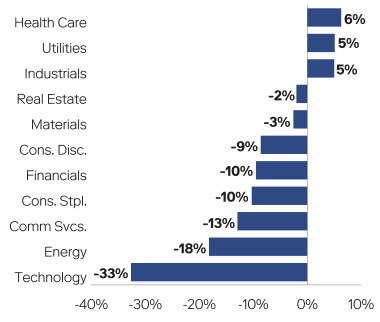
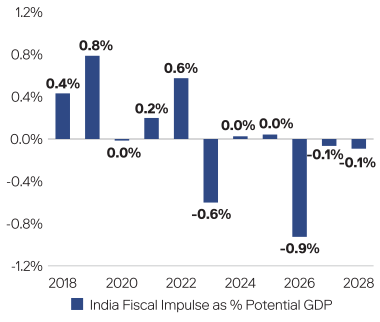
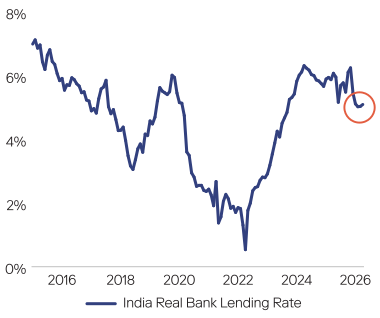
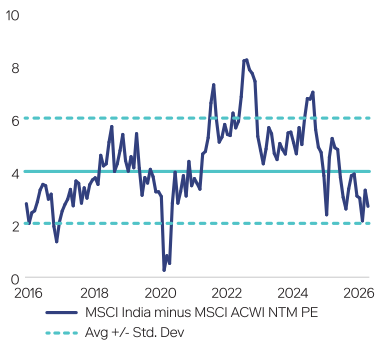
Indian equities have lagged the MSCI ACWI by about 22 pp in 2026, with eight out of 11 sectors selling off (top left chart). The economy remains pressured by a widening current account deficit, contractionary fiscal impulse, negative net foreign portfolio investment, elevated real bank lending rates and dwindling FX reserves to protect a weakening rupee (bottom left and top right charts). Additionally, investors are using India to fund potentially more attractive EM positions in countries such as Korea and Taiwan. Meanwhile, earnings are still being cut, with 2026 EPS growth marked down from approximately 16% at the start of the year to 13% now. While equity valuations have come in a bit, we believe there’s still room for further de-rating (bottom right chart).
The YTD Sell-Off Across Indian
Equities Has Been Broad-Based
Tight Fiscal Policy Could Weigh on Growth
Elevated Bank Lending Rates May Discourage Credit Growth
Despite the Pullback in Valuations, We Believe There May Be Room for Further Declines
Source: Neuberger and FactSet. Data as of July 3, 2026. India Real Bank Lending Rate = weighted average lending rate (WALR) on fresh rupee loans sanctioned, scheduled commercial banks (RBI), less core CPI. Fiscal impulse is calculated as the inverse of the change in IMF Fiscal Monitor cyclically-adjusted primary balance as % of potential GDP. 2026-28 are IMF projections. Top left chart shows sectors in MSCI India Index. Past performance is not indicative of future results. For illustrative and discussion purposes only. Nothing herein constitutes a prediction or projection of future events or future market behavior. Due to a variety of factors, actual events or market behavior may differ significantly from any views expressed.
Health Care: Potential Tech Sell-Off Hedge; Upgrade to Overweight
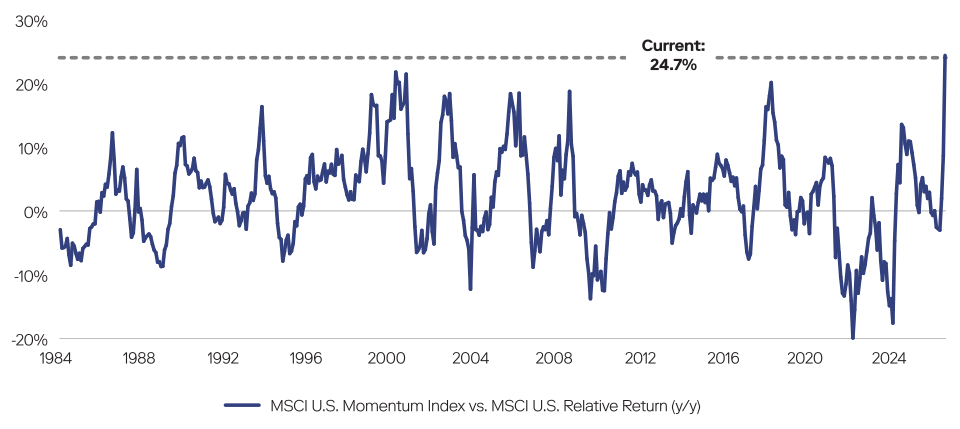
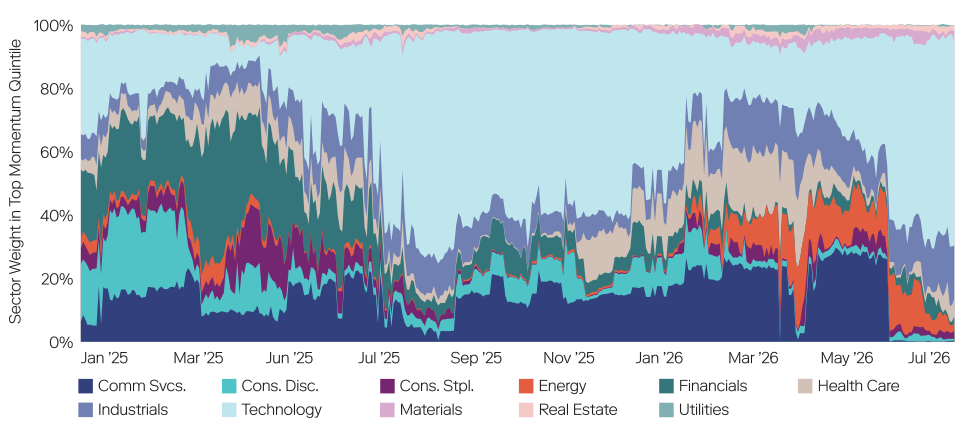
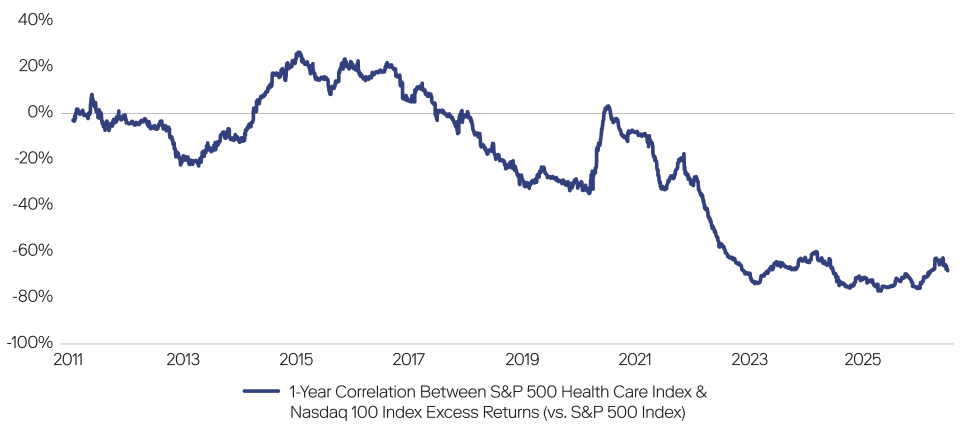
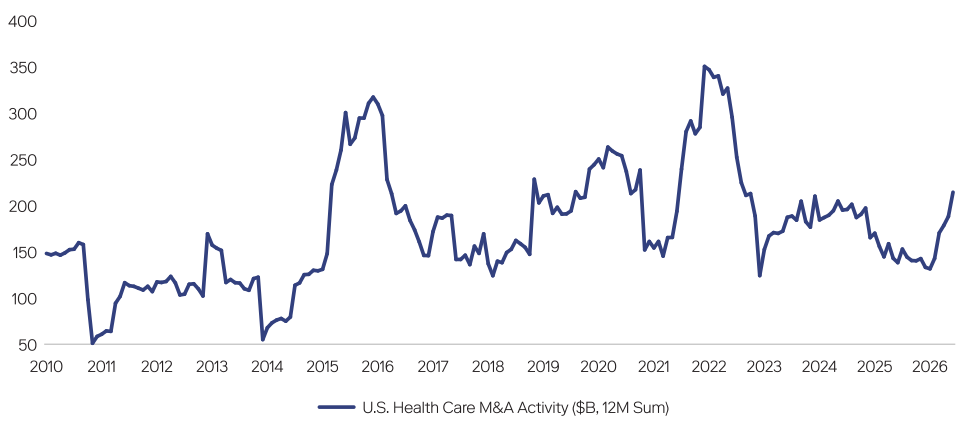
With valuations now at potentially attractive levels versus the broader market, we believe the Health Care sector may be a hedge against potential sell-offs in Tech: Health Care's excess returns vs. the S&P 500 Index are negatively correlated versus the Nasdaq 100 Index, offering a potential cushion should the AI/momentum trade unwind (top chart). At the same time, we believe the sector may stand to benefit from significant AI-driven productivity gains—from drug discovery to diagnostics and care delivery—as well as a handful of structural tailwinds, including a pickup in M&A activity (bottom chart), shorter drug-approval times and reduced regulatory uncertainty.
The Health Care Sector May Offer a Hedge Against a Correction in the Technology Sector
Health Care M&A Activity Has Been Picking Up
Source: Neuberger and FactSet. Data as of July 2, 2026. Past performance is not indicative of future results. For illustrative and discussion purposes only. Nothing herein constitutes a prediction or projection of future events or future market behavior. Due to a variety of factors, actual events or market behavior may differ significantly from any views expressed.
Consumer Staples: Precarious Pricing Power; Downgrade to Neutral
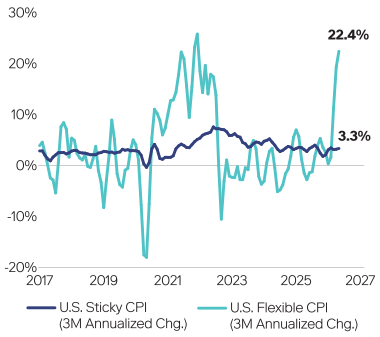
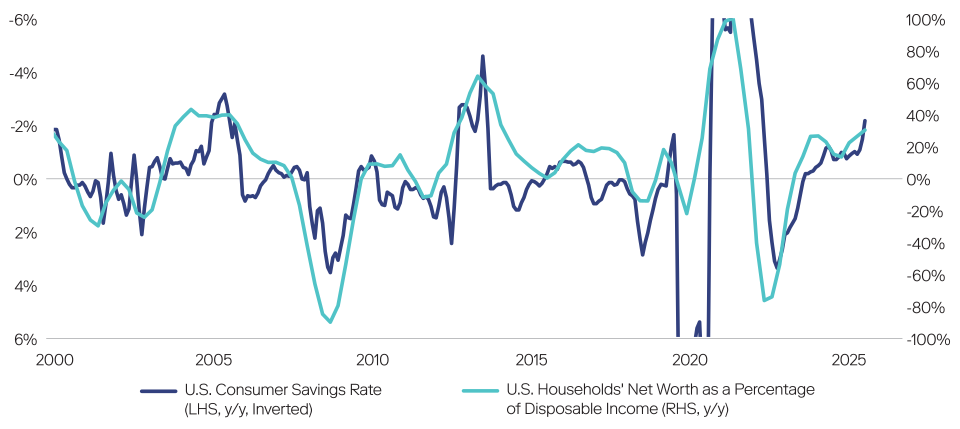
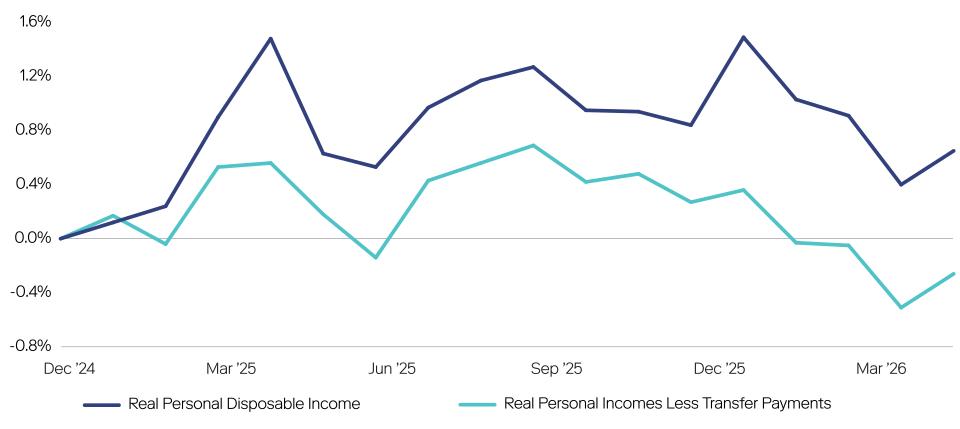
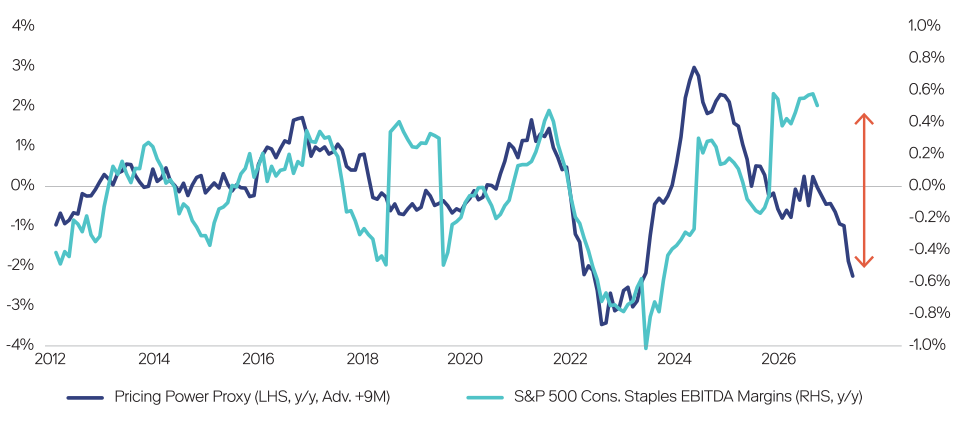
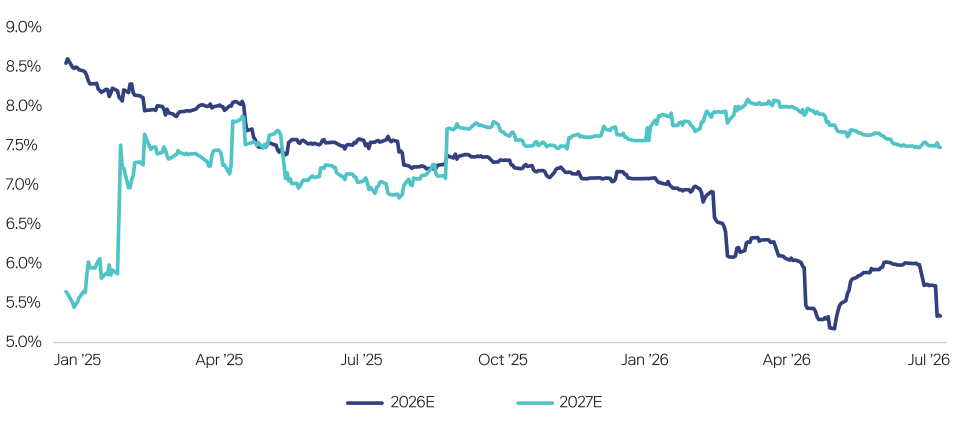
The bottom leg of the K-shaped consumer continues to struggle with shrinking real incomes and historically low savings rates. Amidst those pressures, we fear the Consumer Staples sector may find it harder to maintain pricing power and protect operating margins in coming quarters (top chart). We believe valuations are no longer attractive: The sector trades near the top of its absolute NTM P/E range (~22x) and remains richly priced on a relative basis. Meanwhile, earnings growth estimates continue to get trimmed in the face of various structural headwinds, including tariffs, sticky commodity costs and lower immigration rates (bottom chart).
Potentially Waning Pricing Power May Put Pressure on the Consumer Staples Sector's Operating Margins
Analysts Continue to Trim Earnings Growth Estimates as the Sector Faces Various Structural Headwinds
Consumer Staples EPS Growth Estimate
Source: Neuberger and FactSet. Data as of July 2, 2026. Pricing power proxy is CPI minus PPI. Past performance is not indicative of future results. For illustrative and discussion purposes only. Nothing herein constitutes a prediction or projection of future events or future market behavior. Due to a variety of factors, actual events or market behavior may differ significantly from any views expressed.
Neuberger Regional Equity Recommendations
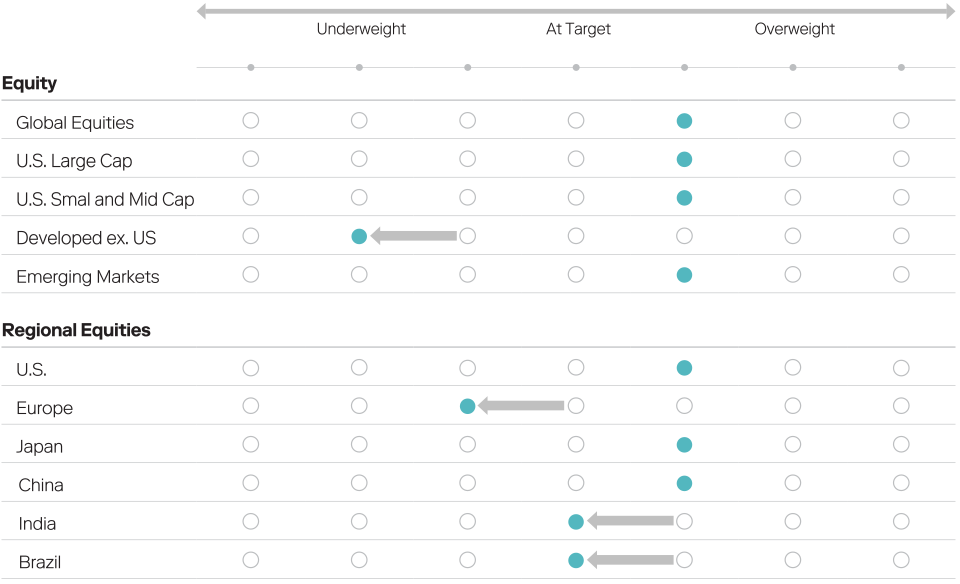
Global Equities (Overweight): Earnings-led, not re-rating. Credit impulse positive (+1.3% of GDP); growth broadening as more economies print 50+ PMIs.
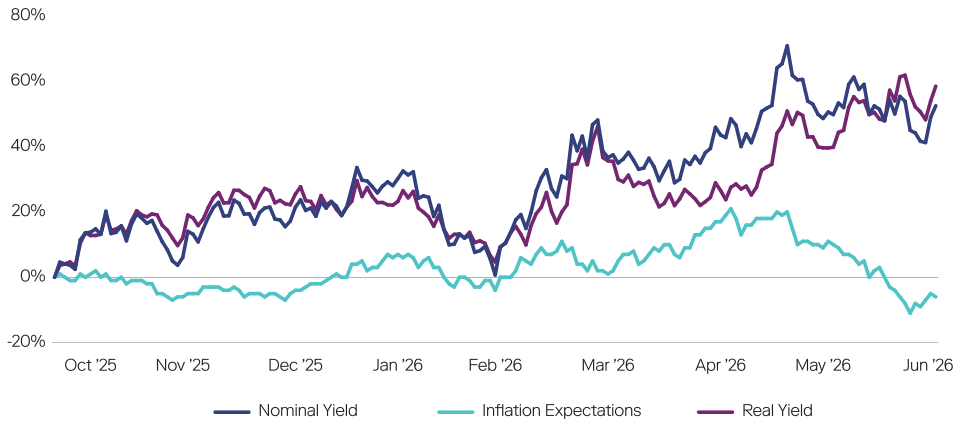
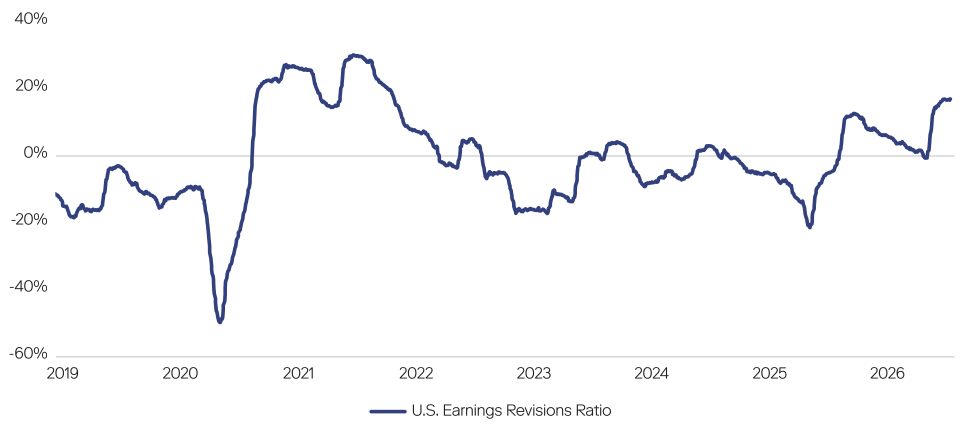
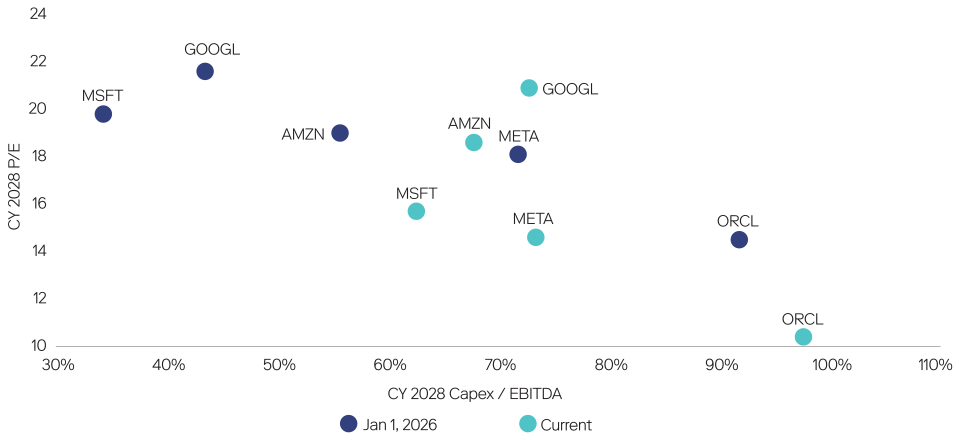
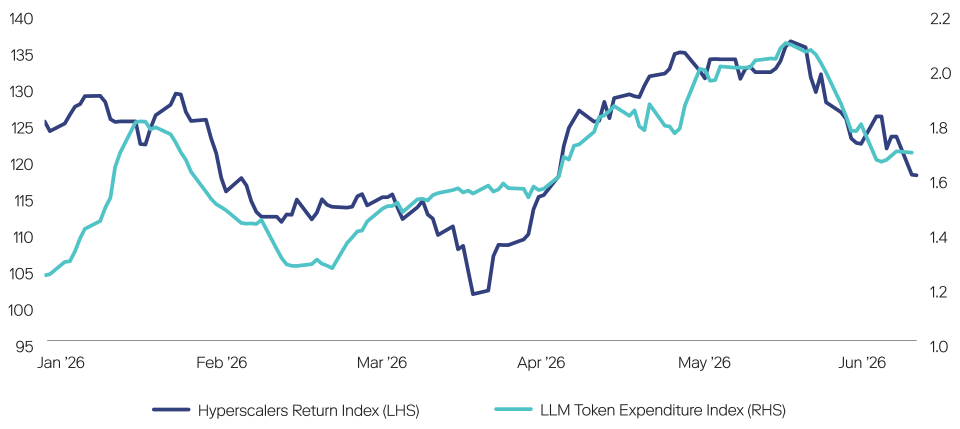
U.S. Large Cap (Overweight): Recovery broadening beyond mega-caps — median stock's best EPS growth in four years. Barbell of quality Tech + cyclicals. Yield back-up is real-led, not inflation. OBBBA and AI capex add support.
U.S. Small and Mid Cap (Overweight): Geared to the industrial recovery and OBBBA capex impulse in 2H'26. Deregulation, lower taxes, reshoring — at a valuation discount. Balanced with quality large-caps given interest rate and geopolitical risk.
Europe (Underweight): Underperformance moves one-for-one with Tech/AI leadership. German growth is hollow — public spending only. 2026 EPS growth is half autos/banks; ECB risks tightening into weakness.
Emerging Markets (Overweight): More cyclical, more geared to global IP than DM. Korea/Taiwan add AI exposure; softer USD and ex-U.S. flow rotation are tailwinds.
Japan (Overweight): Earnings geared to global manufacturing; ample oil reserves cushion the energy shock. Governance reform, rising real wages, and policy support for AI/defense/shipbuilding.
China (Overweight): Investment and exports will support economic growth. “Anti-involution” polices are boosting profits.
India (Neutral): Positive macro headlines offset by elevated real rates (~5%), marked-down EPS revisions, a widening current-account deficit, negative foreign flows, and the largest fiscal drag in a decade.
Source: Neuberger and FactSet. Data as of June 30, 2026. This material is intended as a broad overview of the portfolio managers’ style, philosophy and process and is subject to change without notice. Portfolio managers’ views may differ from other portfolio managers as well as the views of Neuberger. Nothing herein constitutes investment advice or a recommendation to buy, sell or hold a security. It should not be assumed that any investments in securities, companies, sectors or markets identified and described were or will be profitable.
Neuberger U.S. Sector Equity Recommendations
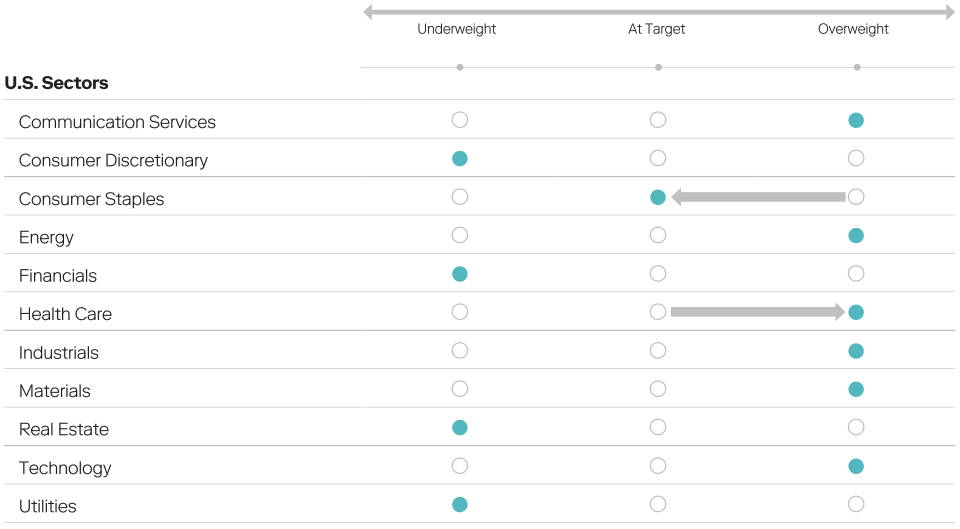
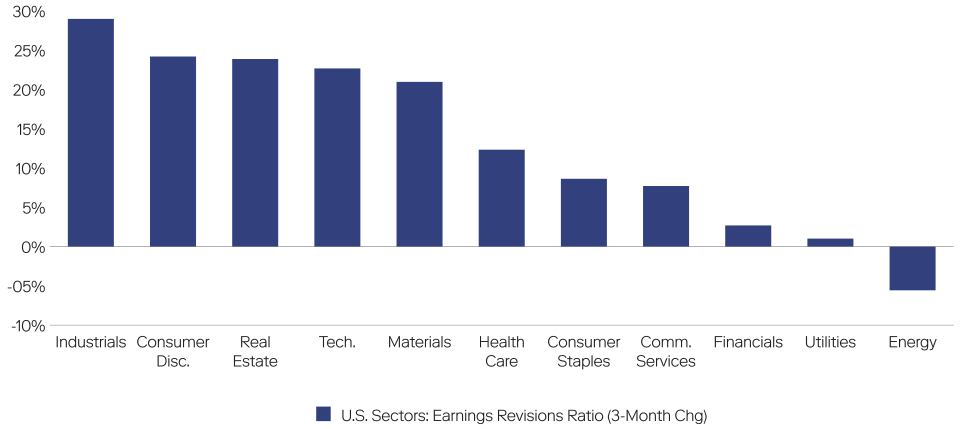
Comm. Services (Overweight): Positive earnings revisions near cycle highs; AI monetization and ad-cycle strength drive upgrades.
Cons. Discretionary (Underweight): Discretionary share of PCE below trend; energy a regressive tax; record equity allocations = reverse wealth-effect risk.
Cons. Staples (Neutral): Negative real income and low savings weigh on volumes as pricing power rolls over. Defensive ballast, limited upside absent a growth scare.
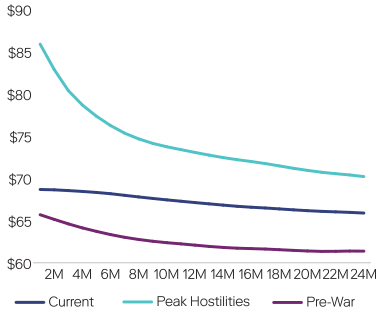
Energy (Overweight): Cheap on relative valuation, estimates lagging spot, flows turning. Not a higher-for-longer crude call.
Financials (Underweight): A leveraged growth play just as geopolitics, high rates, and energy inflation bite. Regulatory reform an added overhang.
Health Care (Overweight): Cheap, revisions inflecting, M&A accelerating. Our quality hedge to an AI/momentum unwind — with AI productivity an under-priced tailwind.
Industrials (Overweight): Direct beneficiary of the manufacturing recovery; OBBBA capex strongest in 1H'26. Non-tech capex revisions turning positive.
Materials (Overweight): Geared to the global industrial recovery; firmer goods prices a pricing tailwind.
Real Estate (Underweight): Stabilizing rates only partial relief; office and supply overhang cap the recovery despite strong near-term revisions.
Technology (Overweight): A selection trade, not a beta trade. Revisions near a 2-yr high; pullback a healthy reset; dispersion (89%) rewards monetization. Own quality.
Utilities (Underweight): Full valuation, crowded positioning, low leverage to the capex cycle — relative appeal fades as growth broadens.
Neuberger and FactSet. Data as of June 30, 2026. This material is intended as a broad overview of the portfolio managers’ style, philosophy and process and is subject to change without notice. Portfolio managers’ views may differ from other portfolio managers as well as the views of Neuberger. Nothing herein constitutes investment advice or a recommendation to buy, sell or hold a security. It should not be assumed that any investments in securities, companies, sectors or markets identified and described were or will be profitable.