It has been a remarkable three years for catastrophe bonds: The Swiss Re Cat Bond Index1 posted double-digit returns in each of 2023, 2024 and 2025, all while navigating active North Atlantic hurricane seasons and the most destructive California wildfires on record. For investors seeking genuine diversification, we believe the asset class has made a compelling case for itself.
Cat bonds are an alternative risk-transfer instrument used, primarily, by insurance and reinsurance companies, and increasingly, by both public and private organizations, to transfer specific natural and, less commonly, non-natural catastrophe risk to the capital markets. These instruments are typically offered as 144A2 floating rate principal-at-risk notes, with maturities of one to five years, and contain specific definitions on the perils and geographies that are covered (also known as “peril regions”3), as detailed in transaction offering documents. Investors receive quarterly or monthly coupons for the term of the bond, made up from the return on the collateral (hence the floating rate) plus the spread (the risk premium) paid by the counterparty (the “sponsor” or “cedant”) to transfer the risk.4
The cat bond market, which currently sits at $63.9 billion of total notional outstanding, continues to grow at a steady pace, as shown in the display below. Along with the return of seasoned repeat issuers, 2025 saw a record 20 first-time sponsors issuing inaugural bonds. Various factors are driving sponsors to increasingly seek additional catastrophe risk coverage via capital markets, including portfolio policy growth, inflationary pressure on the value of risks insured and heightened regulatory scrutiny on capital adequacy requirements. There is also an added benefit for sponsors to diversify away from traditional reinsurance protection.
Growth of the Catastrophe Bond Market ($B)
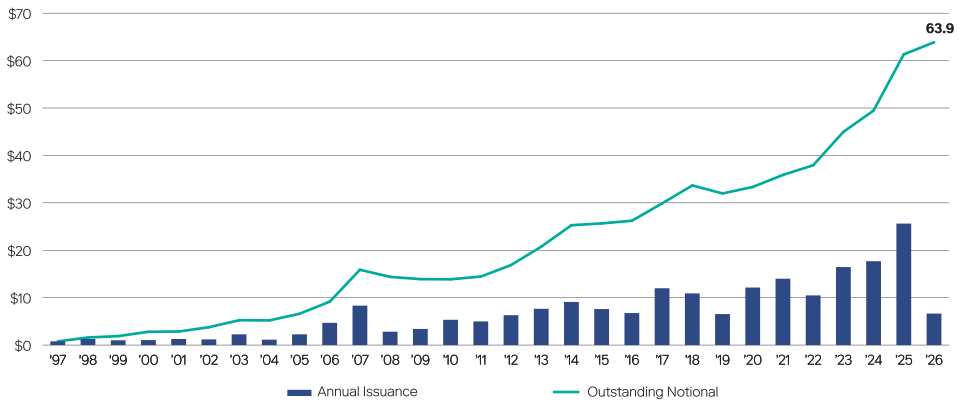
Source: Artemis Deal Directory, excluding private, longevity and mortgage deals (but including cyber) since 2020. Data as of March 31, 2026.
Cat Bonds Currently Provide Favorable Spreads
High barriers to entry into the cat bond space, including the need for bespoke analytical capabilities such as catastrophe risk modelling expertise, and accessibility to primary and secondary market intermediaries, somewhat limit new capital inflows, which remain concentrated in the hands of specialist insurance-linked securities (ILS) managers. This means that while capital has flowed into the market, it has been absorbed by the growing market, a balance that we believe looks set to continue given the potential for significant further issuance growth. Cat bonds are considered the most liquid instrument within the ILS universe, with an active secondary market providing investors with liquidity not commonly available in other ILS strategies, such as collateralized reinsurance, where deployed capital is typically locked up for the duration of a predefined risk period.
For fresh capital deployed into the market, cat bonds still offer an average of 6.7% above the risk-free rate. As the display below shows, this is currently 4.7% above the spread on high yield BB-rated bonds (a traditional asset class with a similar risk profile), with the added benefit of a floating-rate coupon that insulates investors from interest rate uncertainty, coupled with returns that historically have been genuinely uncorrelated to traditional asset classes.
While the market has seen a period of spread-tightening from the elevated levels immediately following Hurricane Ian, we believe the market has reached a state of balance. Current spread levels are sufficiently attractive to encourage sponsors old and new to issue bonds; this is supporting further deepening of the market and broadening the covered peril region universe, allowing ILS managers to diversify their own portfolio exposure. Crucially, these spread levels are also compensating investors for the underlying risk in cat bond transactions.
Cat Bond Market Spread1 vs. High Yield BB Spread2
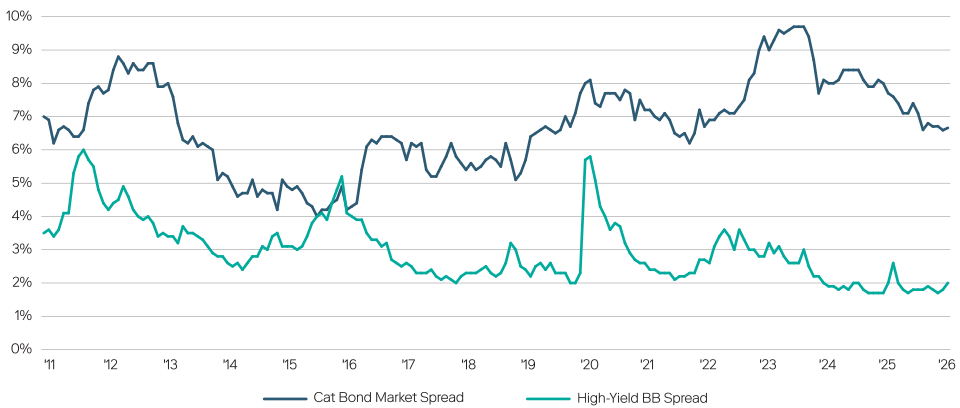
1Source: ICE BofA BB U.S. High Yield Index Option-Adjusted Spread (BAMLH0A1HYBB) via FRED, Federal Reserve Bank of St. Louis.. Data as of March 31, 2026.
2Source: Bloomberg, Lane Financial. Includes 144A notes covering natural and non-natural catastrophe risks. Issuance-weighted and one-year rolling average. Data as of March 31, 2026.
Low Correlations Indicate Cat Bonds’ Diversification Benefits
Beyond the attractive spreads on offer, cat bonds have historically delivered returns that are fundamentally uncorrelated to traditional financial markets, a quality that has been highlighted by recent global macro events. The outbreak of the Middle East conflict in February sent turbulence reverberating across financial markets, with Corporate High Yield5 and the S&P 5006 experiencing March drawdowns of -1.2% and –5.0%, respectively, while the Swiss Re Cat Bond Index returned +0.8%.
There is some potential for flows-related mark-to-market risks. This was seen in March 2020 following the outbreak of COVID-19, when multi-strategy hedge funds looked to rebalance their portfolios. However, such events tend to be both muted and short-lived given the specialist nature of the market and the ability of these specialists to step in as liquidity providers. Since 2002, the correlation coefficient between cat bonds and indices representing the returns of other asset classes, shown in the following table, has remained at or below 0.26.
Correlation Across Asset Classes
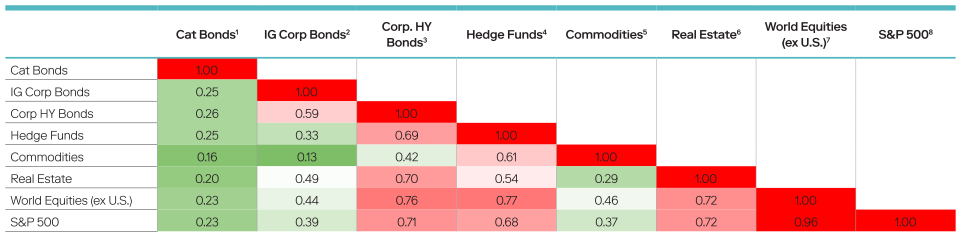
Source: Bloomberg. Calculated for the period February 28, 2002, to March 31, 2026.
1The Swiss Re Cat Bond Total Return Index. SRCATTRR Index.
2Dow Jones Corporate Bond Total Return Index. DJCBT Index
3Bloomberg Barclays U.S. Corporate High Yield Total Return Index. LF98TRUU Index.
4Credit Suisse Hedge Fund Index. HEDGNAV Index. Please note correlation calculations for this index are based on the period February 28, 2002, to February 28, 2026.
5Bloomberg Commodity Index. BCOM Index.
6Dow Jones U.S. Real Estate Total Return Index. DJUSRET Index.
7MSCI ACWI ex USA. GDUEACWF Index.
8SPTR Index.
Cat Bonds Have Performed Well While Delivering Low Volatility
The following figures show the historical returns of the Swiss Re Cat Bond Index versus Corporate High Yield, the S&P 500 and World Equities (ex U.S.) from February 2002 to present. Over the full period examined, the annualized return of cat bonds, 7.7%, compares favorably to 7.1% for High Yield, but it is over the past five years that the divergence becomes particularly striking, with cat bonds returning 10.3% annualized versus 4.2% for High Yield. Additionally, this outperformance has been delivered at a fraction of the volatility, which since 2002, sits at 3.7% for cat bonds against 8.8% for High Yield. Although cat bonds have outperformed equities so far this year (through March 31, 2026), equities have posted higher returns since 2002. That said, equities’ annualized volatility over the full period has been significantly higher at 15.4% and 14.8% for World Equities (ex U.S.) and the S&P 500, respectively, exposing investors to considerably greater drawdown risk during periods of acute market stress.
Historical Index Performance
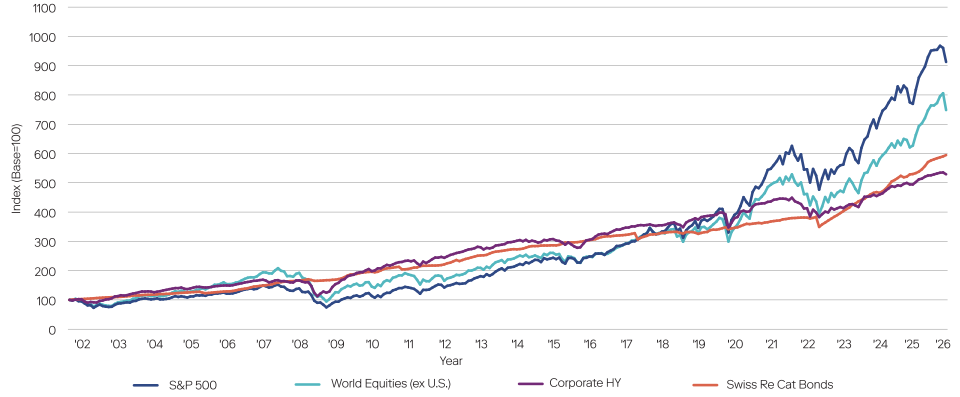
Source: Bloomberg. Calculated for the period February 28, 2002, to March 31, 2026.
1The Swiss Re Cat Bond Total Return Index. SRCATTRR Index.
2Bloomberg Barclays U.S. Corporate High Yield Total Return Index. LF98TRUU Index.
3MSCI ACWI ex USA. GDUEACWF Index.
4S&P 500 Index. SPTR Index.
Index Returns and Volatility
| Cat Bonds1 | Corporate HY2 | World Equities (ex U.S.)3 | S&P 5004 | |
|---|---|---|---|---|
| 2026 Calendar Year-to-Date Return (%) | 1.8% | -0.5% | -2.8% | -4.3% |
| 5-Year Annualized Return (%) | 10.3% | 4.2% | 10.0% | 12.1% |
| Full Period Annualized Return (%) | 7.7% | 7.1% | 8.7% | 9.6% |
| Annualized Volatility (%) | 3.7% | 8.8% | 15.4% | 14.8% |
Source: Bloomberg. Calculated for the period February 28, 2002, to March 31, 2026."
1The Swiss Re Cat Bond Total Return Index. SRCATTRR Index.
2Bloomberg Barclays US Corporate High Yield Total Return Index. LF98TRUU Index.
3MSCI ACWI ex USA. GDUEACWF Index.
4S&P 500 Index. SPTR Index.
The next table compares the returns of the four indices following periods of acute financial market stress. Cat bonds experienced a maximum monthly drawdown of just -1.8% during the 2008 Global Financial Crisis (GFC), versus -19.8% for World Equities (ex U.S.), -16.8% for the S&P 500 and -15.9% for High Yield, recovering to their prior high water mark within just 10 months compared with an average of 47 months across the other three indices. During COVID-19, cat bonds again experienced minimal losses, with a maximum monthly drawdown of -1.8%, compared to -13.4% for World Equities (ex U.S.), -12.4% for the S&P 500 and -11.5% for High Yield.
While the drawdown of cat bonds in 2022 coincided with the rate-driven sell-off in traditional asset classes, the cause was unrelated, driven primarily by the occurrence of Hurricane Ian in September. Despite Ian being the costliest insured loss event on record,7 the index recovered within six months, compared to 24 months for the equity and high yield indices.
The resilience of cat bonds following significant historical natural catastrophe events has given investors further comfort with the asset class. In addition to Hurricane Ian, this is reflected in results following the California wildfires of January 2025, when, despite being reported collectively as the costliest insured wildfire loss events on record,8 the Swiss Re Total Return index only experienced a drawdown of -0.96% in January, recovering to its high watermark in March. Given the significant implications of these events for the traditional reinsurance industry, the fast recovery rate of cat bonds following Ian and only moderate drawdown following the wildfires highlight the risk-remoteness of cat bonds in a typical cedant’s reinsurance tower.
Performance During Market Stress Events
| Event | Metric | Cat Bonds | Corp. HY Bonds | World Equities (ex U.S.) | S&P 500 |
|---|---|---|---|---|---|
| 2007 – 08 GFC | Maximum Monthly Drawdown (%) |
-1.8% | -15.9% | -19.8% | -16.8% |
| Months to Recover | 10 | 21 | 66 | 53 | |
| COVID-19 | Maximum Monthly Drawdown (%) |
-1.8% | -11.5% | -13.4% | -12.4% |
| Months to Recover | 4 | 7 | 8 | 7 | |
| 2022 Rate Shock / Ian | Maximum Monthly Drawdown (%) |
-9.0% | -6.7% | -9.5% | -9.2% |
| Months to Recover | 6 | 24 | 24 | 24 | |
| 2025 U.S. Tariffs | Maximum Monthly Drawdown (%) |
N/A* | -1.0% | -3.9% | -5.6% |
| Months to Recover | N/A* | 3 | 4 | 5 |
*No drawdown experienced.
Source: Bloomberg. Calculated for the period February 28, 2002 to March 31, 2026. “Months to Recover” is defined as the number of months taken for the index to return to its prior watermark.
Conclusion: Genuine Diversification in Turbulent Times
Demand for cat bonds has grown as investors increasingly recognize their diversification benefits, while sponsors have come to truly value capital markets as a reliable and complementary source of capacity, typically sitting alongside traditional reinsurance. In our view, this growth is still very much in its early phases, with significant future potential, while the market should be able to absorb new inflows through specialist ILS managers. In our opinion, spreads remain attractive both on an outright basis and relative to comparable fixed income asset classes. In addition, even if the conflict in the Middle East is resolved quickly, it no longer seems inevitable that interest rates will fall during 2026, making bonds without duration risk an attractive portfolio proposition. The catastrophe bond market has ridden periods of inflationary pressure in recent years and has some relatively efficient mechanisms to help mitigate its impacts. These include annual resets, the ability of indemnity cedants to project forward their book value to incorporate inflation assumptions and the precedence for the inclusion of inflation factors in industry index deals. Most importantly, projected inflation can be reflected in the pricing of new deals coming to market to ensure the paid risk spread compensates for any post-event changes in risk. Given the concentrated and specialized nature of the cat bond market, this is an area where pricing power can be demonstrated.
With periods of macro uncertainty and volatility in risk assets likely to remain in investors’ focus, we believe cat bonds remain a very compelling opportunity for investors seeking genuine diversification within their portfolios.