Small and Mid Caps: Taking Profits; Trim to Neutral
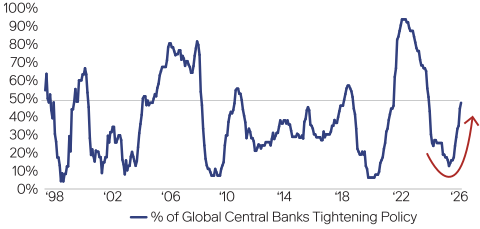
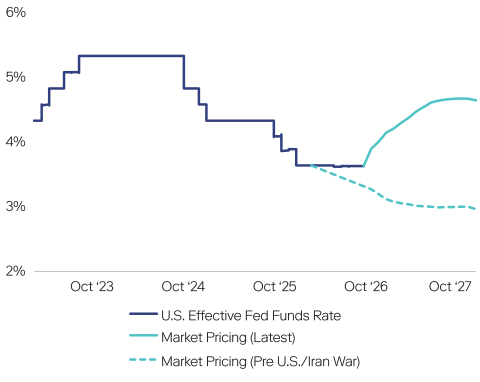
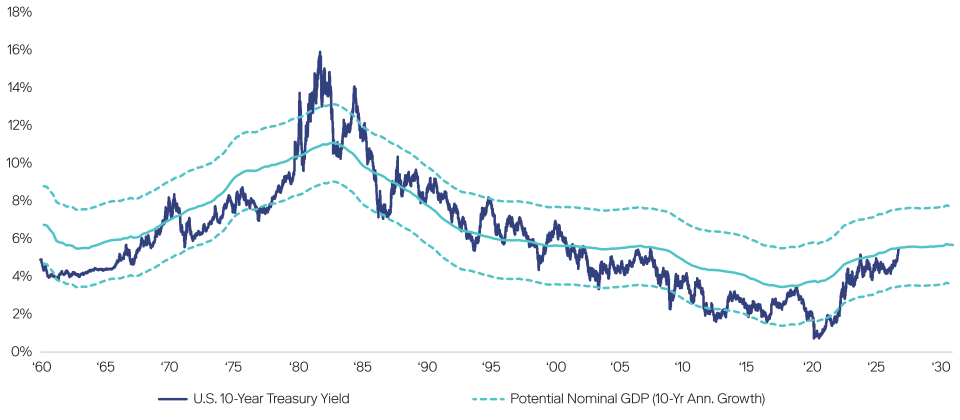
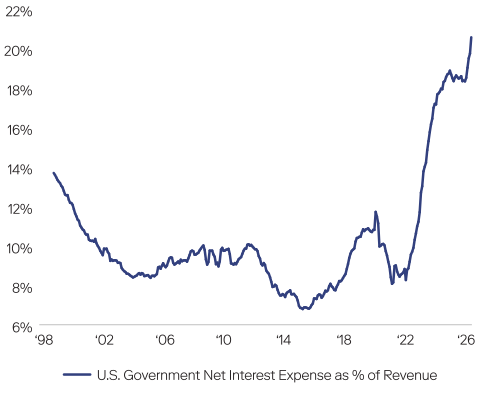
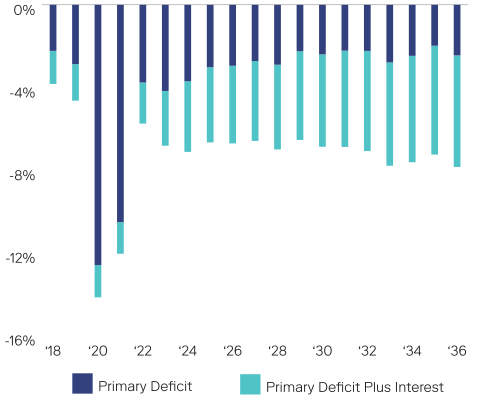
We have been overweight small caps since 2024, but rising rates and a shifting balance of risks now argue for a tilt toward higher-quality, lower-beta stocks—and by extension, large caps over small caps.
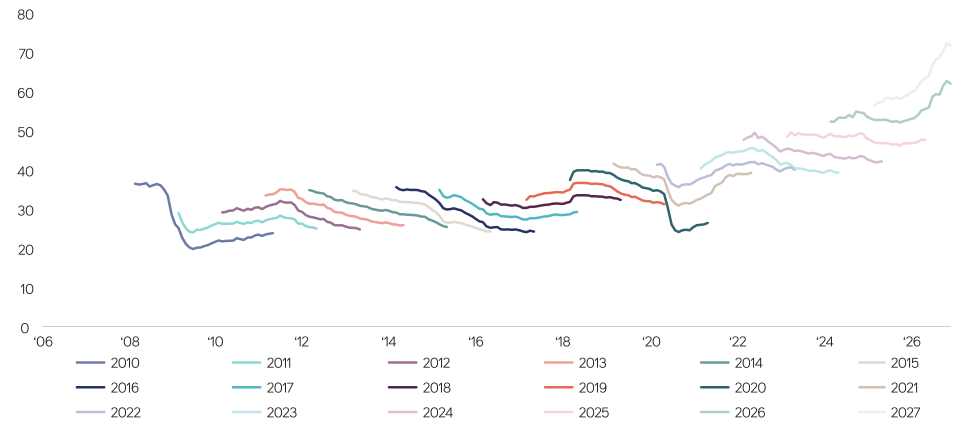
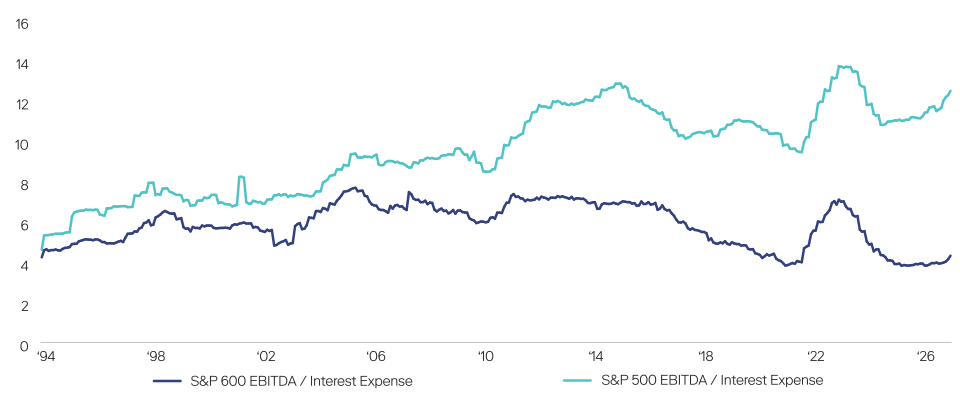
Small caps tend to finance themselves via short and floating-rate debt: Almost 45% of small cap debt is floating rate with the majority set to mature within the next 5 years. Their ability to sustain that debt has decreased since the GFC: Small cap interest coverage ratios have fallen over the past decade and are now one third that of large caps (top chart).
Meanwhile, we believe the Russell 2000 Index has gotten riskier: Over 28% of the index has negative forward earnings vs. just 4% of the Russell 1000 Index, and a recent index reshuffling upped the weights in more speculative pockets, including biotech and regional banks (sectors likely to be pressured by elevated rates).
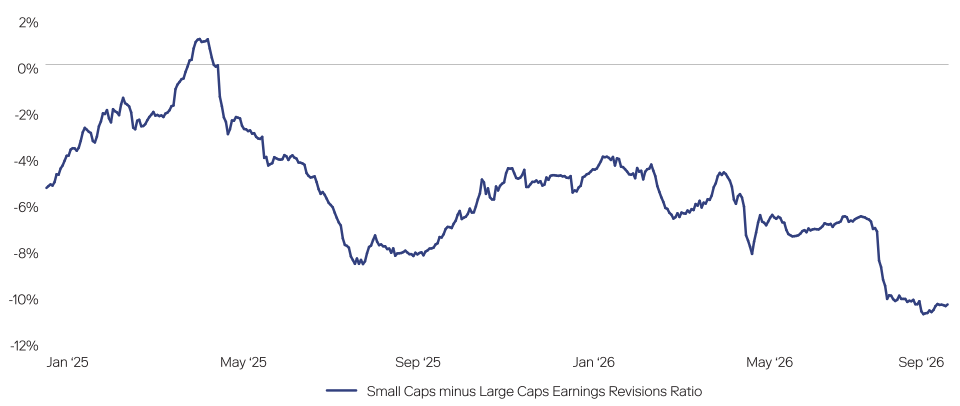
Finally, small cap earnings estimates are being revised lower, especially when compared to large caps (bottom chart). Since July 1, the 2026 EPS estimate for the Russell 2000 Index has been cut by over 5%, driven by 9 of the 11 sectors.
Small Cap Interest Coverage Is Just One Third That of Large Caps
Small Cap Positive Earnings Revisions Are Trailing Large Cap Revisions
Source: Neuberger, Mill Street Research, BofA, J.P Morgan, and FactSet. Data as of September 30, 2026. Past performance is not indicative of future results.
Nothing herein constitutes a prediction or projection of future events or future market behavior. Due to a variety of factors, actual events or market behavior may differ significantly from any views expressed or any historical results. This material is intended as a broad overview of the Portfolio Managers’ style, philosophy and process and is subject to change without notice. Portfolio Managers’ views may differ from those of other Portfolio Managers as well as the views of Neuberger. See Disclosures at the end of this presentation.
Value vs. Growth: Remain Neutral
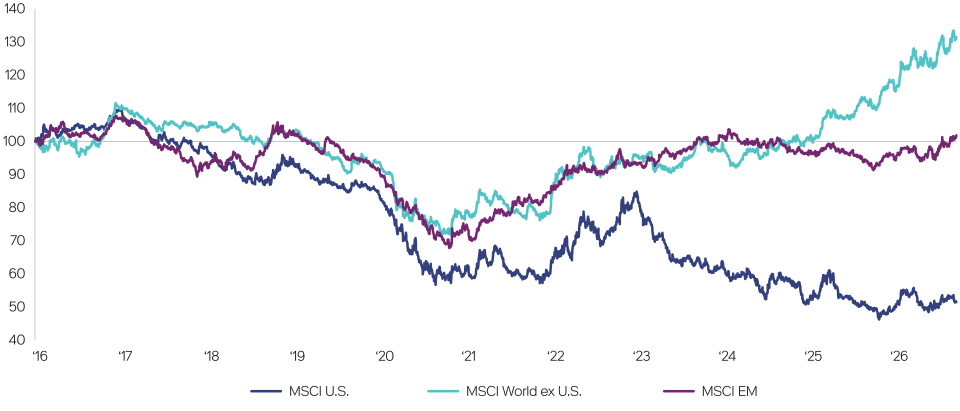
Value stocks have outperformed growth stocks, just not in the U.S.: Over the last decade, value has outperformed growth by about 30% outside the U.S., roughly matched it in EM, but has underperformed by 50% in the U.S. (top chart). We find that value benchmarks tend to be underweight technology and overweight more traditional, economically sensitive sectors. In the U.S., that meant missing the AI winners; outside the U.S., it meant owning the recovery in European banks, and in Japan, the tailwind from key governance reforms.
Value offers exposure to the ongoing cyclical manufacturing recovery, diversification away from the AI theme, and potential room for valuations to re-rate. We find the earnings of value companies are about 1.2 times as sensitive to the global economy as the earnings of growth companies (bottom chart). Value indices tend to be less concentrated in AI and tech-adjacent names than growth indices. And while relative valuations have re-rated, they do not appear stretched: the value-growth PE gap is only back to its historical average.
Different Sector Exposures Have Driven Vastly Different
Regional Value-vs.-Growth Relative Performance
Value vs. Growth Relative Return
Value Stocks' Earnings Tend to Be More Sensitive to Economic Activity Than Growth Stocks' Earnings
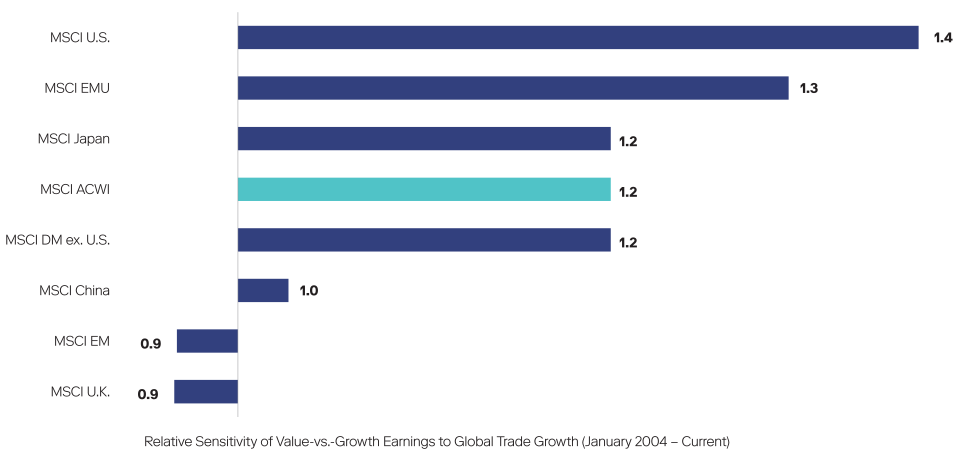
Source: Neuberger and FactSet. Data as of September 30, 2026. LHS chart rebased to 100 on Jan. 2004 - Current Past performance is not indicative of future results.
Nothing herein constitutes a prediction or projection of future events or future market behavior. Due to a variety of factors, actual events or market behavior may differ significantly from any views expressed or any historical results. This material is intended as a broad overview of the Portfolio Managers’ style, philosophy and process and is subject to change without notice. Portfolio Managers’ views may differ from those of other Portfolio Managers as well as the views of Neuberger. See Disclosures at the end of this presentation.
Emerging Markets: AI Dominates the Index; Downgrade to Neutral
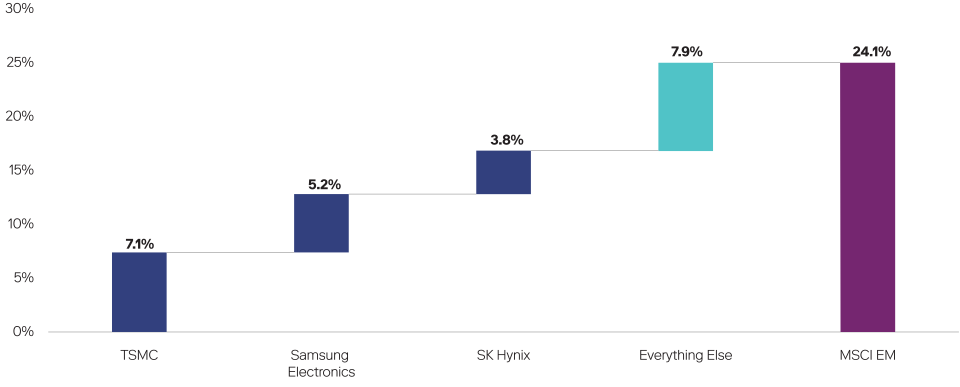
The MSCI EM Index is up 24% this year: Of that return, TSMC, Samsung and SK hynix delivered roughly 70% (left chart), and Korean and Taiwanese technology companies are driving about two-thirds of expected index earnings growth (top chart). We believe broad EM exposure is now a concentrated AI bet that we’d prefer to make with U.S. large caps (bottom chart).
In Emerging Markets, we prefer selectivity to owning the broader index's beta. Dispersion within EM is the highest of any major index. Within EM equities, we maintain our preference for Chinese equities, which are broadly geared to AI, global growth and, increasingly, domestic demand as early signs of government stimulus emerge. We are neutral on Latin America, though we think Brazil stands out as an uncrowded, rate-sensitive domestic play, with further room for appreciation once monetary policy eases.
Just Three Stocks Delivered About 70% of the EM Index’s Return This Year
Contribution to MSCI EM YTD Return
Korea and Taiwan Have Been the Most Sensitive to the Semiconductor Subsector Compared to Other EM Markets
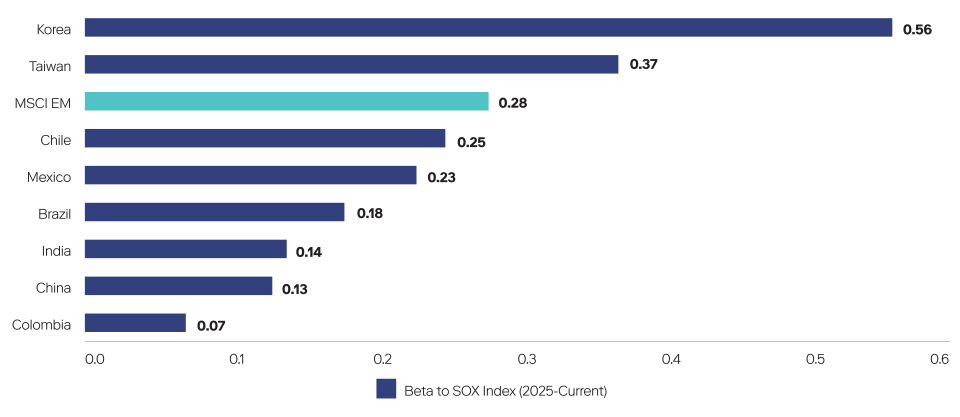
Source: Neuberger, S&P Dow Jones Indices, UBS, J.P. Morgan, Goldman Sachs and Factset. Data as of October 8, 2026. Right: beta of weekly USD total returns of MSCI indices to the Philadelphia Semiconductor Index (SOX), January 2025 to September 2026. Past performance is not indicative of future results.
Nothing herein constitutes a prediction or projection of future events or future market behavior. Due to a variety of factors, actual events or market behavior may differ significantly from any views expressed or any historical results. This material is intended as a broad overview of the Portfolio Managers’ style, philosophy and process and is subject to change without notice. Portfolio Managers’ views may differ from those of other Portfolio Managers as well as the views of Neuberger. See Disclosures at the end of this presentation.
Japan: Long-term Potential; Remain Overweight
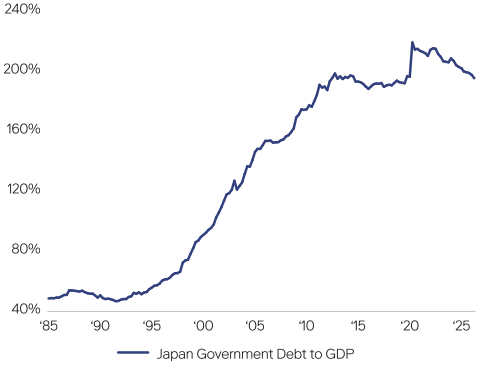
We remain overweight Japan, where corporate-governance reform continues to support long-term equity growth. Macro indicators reflect an economy still in expansion: Manufacturers’ capex sentiment is rising; bank loan growth exceeds 5% a year; fiscal policy tailwinds may extend into 2027; and government debt-to-GDP has fallen from ~220% in 2020 to ~195% (top left chart).
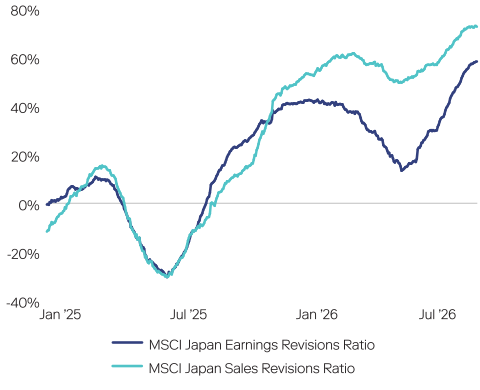
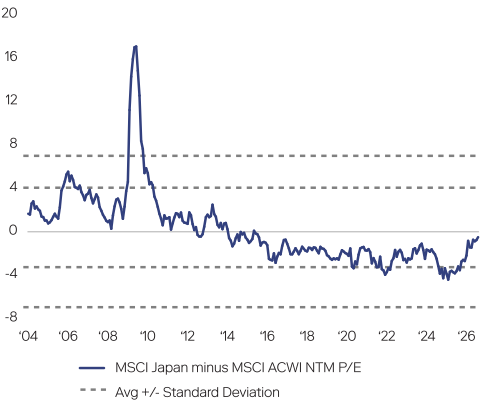
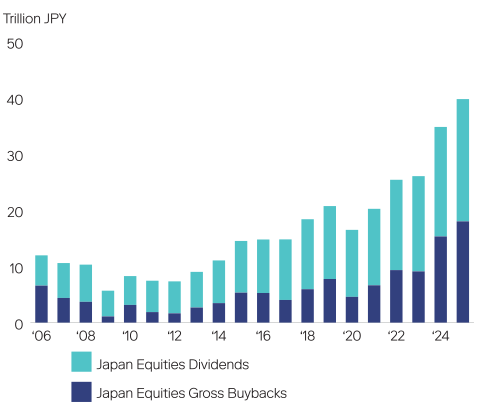
Earnings and sales estimates for the MSCI Japan Index are still being revised higher (top right chart), yet we think valuations remain attractive, trading roughly in line with the MSCI ACWI Index on forward P/E (bottom left chart). Capital efficiency is also improving: Shareholder payouts hit a record ~¥40Tn in FY2025, double 2021 levels, with buybacks nearly half the total and a ~4.1% shareholder yield, above its 20-year average (bottom right chart).
(For more on our Japan team’s view, see "Cruising Altitude: Growth-Focused Governance Reform May Propel Japanese Equities to New Heights.")
Japan Is Chipping Away At Its Overall Debt Load
Positive Earnings and Sales Revisions Have Turned Sharply Higher
Yet Japan’s Broader Index Still Trades Roughly in
Line With the Global Benchmark
Japanese Companies Are Taking Steps Toward Greater Capital Efficiency, Including Dividends and Buybacks
Source: Neuberger and FactSet. Data as of September 30, 2026. Past performance is not indicative of future results.
Nothing herein constitutes a prediction or projection of future events or future market behavior. Due to a variety of factors, actual events or market behavior may differ significantly from any views expressed or any historical results. This material is intended as a broad overview of the Portfolio Managers’ style, philosophy and process and is subject to change without notice. Portfolio Managers’ views may differ from those of other Portfolio Managers as well as the views of Neuberger. See Disclosures at the end of this presentation.
Neuberger Regional Equity Recommendations
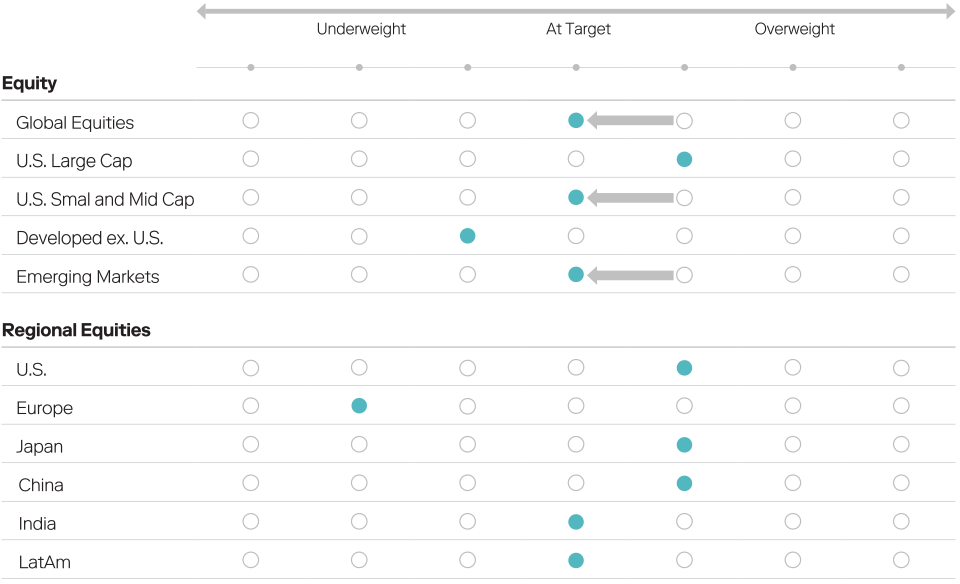
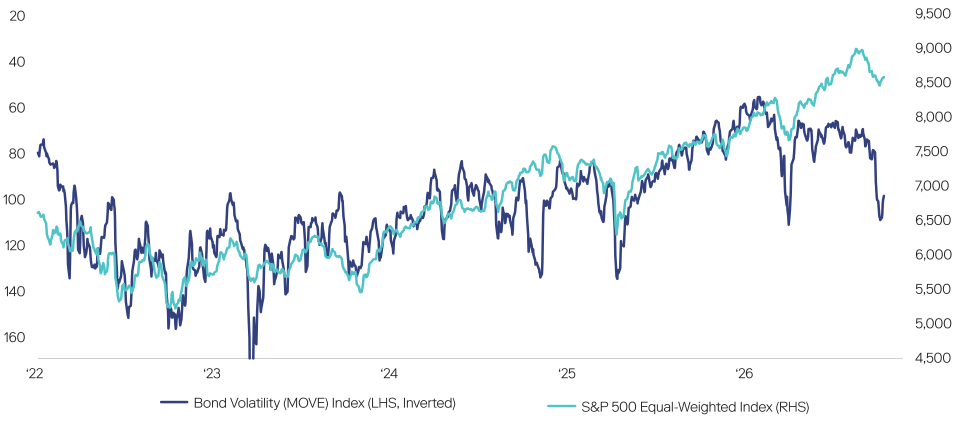
Global Equities (Neutral): Downgraded from overweight. Fundamentals are intact, but the balance of risks has shifted: A market break could hit both AI capex and the wealth effect; valuations are exposed to rates and bond volatility; and the AI buildout relies on capital markets.
U.S. Large Cap (Overweight): Strongest earnings quality and AI capex conviction, in our view; earnings broadening beyond mega-caps. Barbell of quality Tech and cyclicals, with Health Care as an AI hedge.
U.S. Small and Mid Cap (Neutral): Downgraded from overweight after a strong run. Most exposed to floating-rate funding and refinancing as rates rise; the group may suffer from weaker interest coverage, input-cost pressure, and softening earnings estimates.
Europe (Underweight): Equity performance has been disconnected from a hollow economy; German growth is driven primarily by government stimulus. Half of 2026 EPS growth is from banks, energy and autos; ECB risks tightening into weakness.
Emerging Markets (Neutral): Downgraded from overweight. Index concentration in a handful of semiconductor names has turned broad EM into a technology proxy. We favor select EM tied to domestic growth rather than broad EM beta.
Japan (Overweight): Moving from reflation to a capex boom; earnings and sales revisions near highs. Governance reforms are gaining traction; shareholder payouts are at a record high; still, valuations in line with ACWI.
China (Overweight): Investment and export driven growth offsetting slowing domestic demand. Further deterioration in data likely to incentivize stimulus. "Anti-involution" healing the profit cycle.
India (Neutral): Positive macro headlines offset by elevated real rates (~5%), marked-down EPS revisions, a widening current-account deficit, and the largest fiscal drag in a decade.
Source: Neuberger and FactSet. Data as of September 30, 2026. This material is intended as a broad overview of the Portfolio Managers’ style, philosophy and process and is subject to change without notice. Portfolio Managers’ views may differ from those of other Portfolio Managers as well as the views of Neuberger. See Disclosures at the end of this presentation.
Neuberger U.S. Sector Equity Recommendations
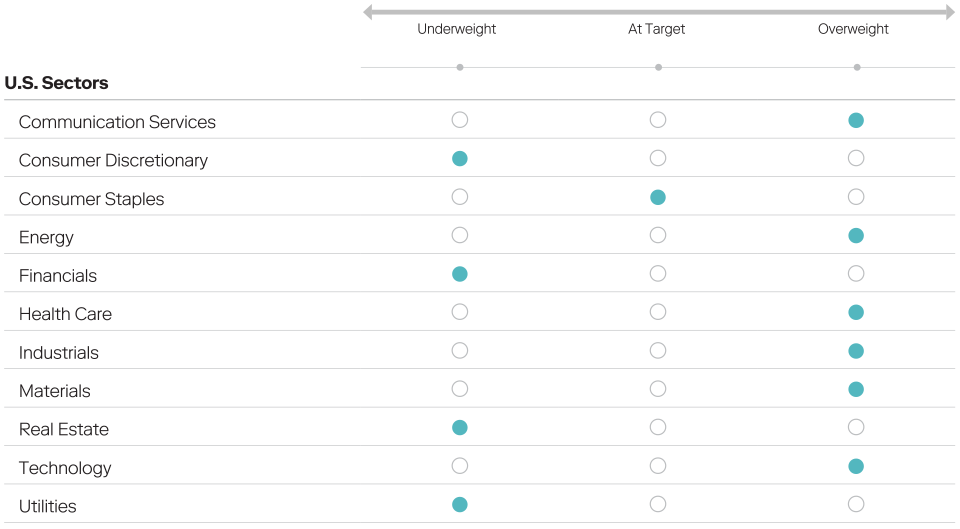
Comm. Services (Overweight): Earnings revisions are still positive on AI monetization and ad strength. Within the sector, we favor the AI plays over telecoms.
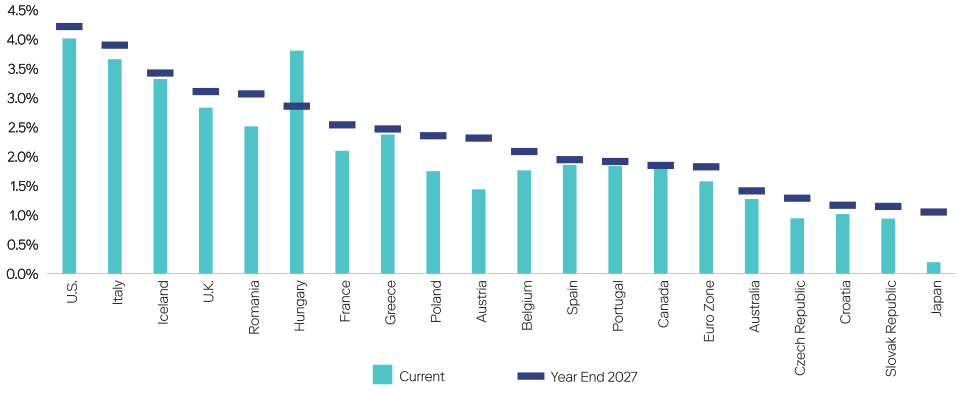
Cons. Discretionary (Underweight): Higher rates and energy prices are a regressive tax on the low-end consumer. Record household equity allocations may be increasing reverse wealth-effect risk. Homebuilders are the most rate-sensitive group, and AI agents threaten travel and subscription models.
Cons. Staples (Neutral): Defensive ballast, but negative real income and fading pricing power could cap volumes. Limited upside absent a broader growth scare.
Energy (Overweight): Cheap relative valuation; earnings estimates lag spot prices; winner from higher real yields. Not a bullish call on crude, but a hedge against Middle East escalation.
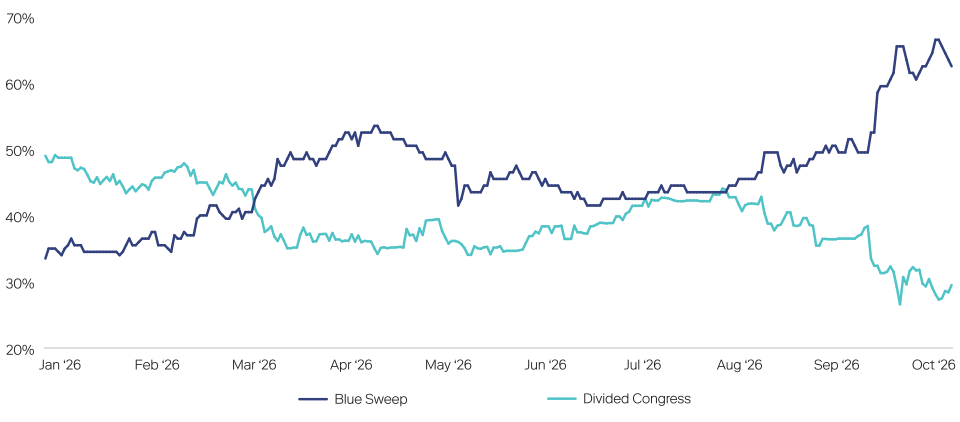
Financials (Underweight): Higher real yields help, but the sector is especially leveraged to growth and most exposed if a market break tightens financing. A Democratic sweep would add regulatory risk.
Health Care (Overweight): Modest valuations, increasing positive earnings revisions and accelerating M&A make this a quality hedge if momentum and AI leadership falter. Services subsector preferred.
Industrials (Overweight): The manufacturing upcycle will be hard to cut short, and the AI buildout is spilling over into power, grid and electrical equipment, where capacity is the bottleneck.
Materials (Overweight): Geared to the manufacturing upcycle, and copper demand from electrification and AI power supports pricing. We favor metals over chemicals, where oversupply persists.
Real Estate (Underweight): Among the sectors most hurt by higher real yields; fiscal strain and bond volatility keep long-term financing costs high, and oversupply of office space may cap the recovery.
Technology (Overweight): We believe in AI and the broader build-out, but would rather get selective exposure, including hyperscalers, software companies with accelerating recurring revenue, and other names fortified by cash over those reliant on capital markets.
Utilities (Underweight): While the sector’s relative P/E sits near the bottom of its 10-year range, utilities (as bond proxies) lose most as yields and bond volatility rise. We prefer to get AI power exposure through Industrials instead.
Source: Neuberger and FactSet. Data as of September 30, 2026. This material is intended as a broad overview of the Portfolio Managers’ style, philosophy and process and is subject to change without notice. Portfolio Managers’ views may differ from those of other Portfolio Managers as well as the views of Neuberger. See Disclosures at the end of this presentation.
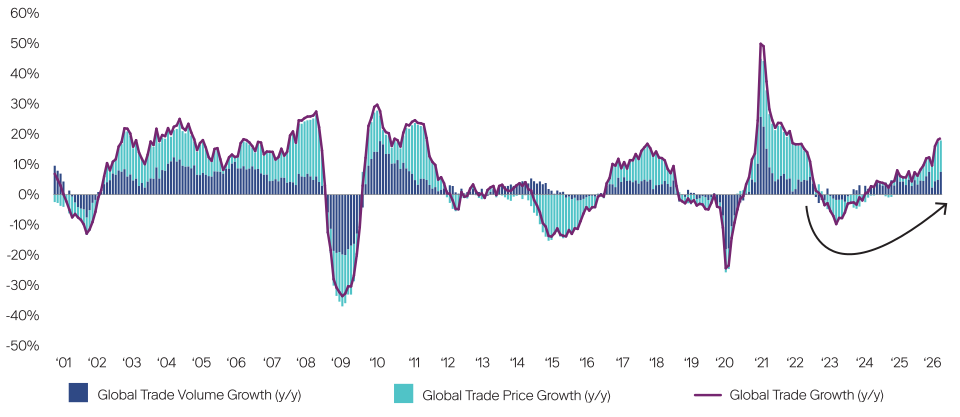
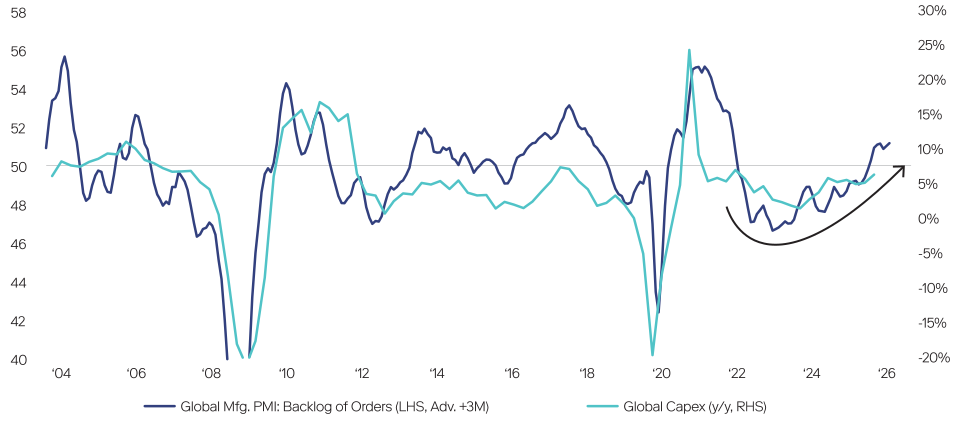
 Source: Neuberger and FactSet. Data as of September 30, 2026. Past performance is not indicative of future results. Nothing herein constitutes a prediction or projection of future events or future market behavior. Due to a variety of factors, actual events or market behavior may differ significantly from any views expressed or any historical results. This material is intended as a broad overview of the Portfolio Managers’ style, philosophy and process and is subject to change without notice. Portfolio Managers’ views may differ from those of other Portfolio Managers as well as the views of Neuberger. See Disclosures at the end of this presentation.