The IPO Window Has Reopened for Select Issuers, but Most Exits Still Happen Outside Public Markets
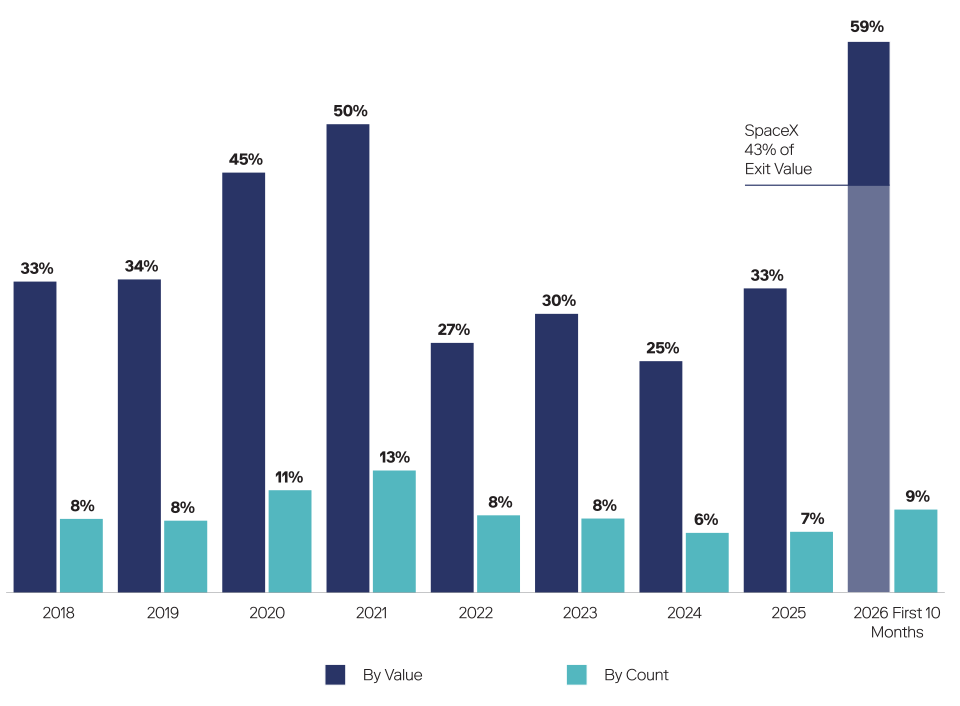
IPO Share of Global PE- and VC-Backed Exits (% of Total)
Source: PitchBook as of October 26, 2026. IPO exit value reflects pre-money IPO value.
Note: The securities mentioned are for illustrative purposes only. Nothing herein constitutes investment advice or a recommendation to buy, sell or hold a security. It should not be assumed that any investments in securities, companies, sectors or markets identified and described were or will be profitable.
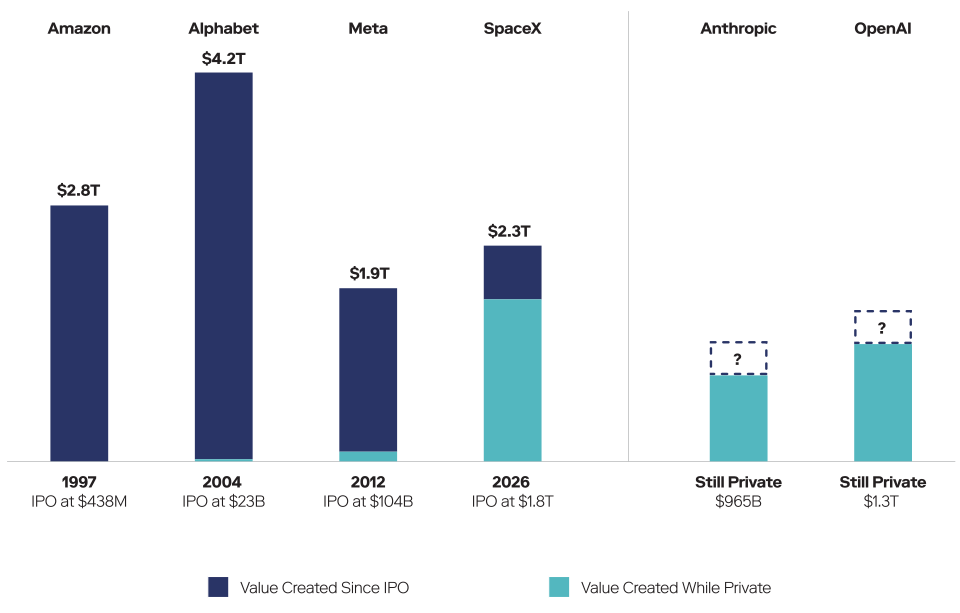
SpaceX's IPO in June, which raised $86 billion at a valuation of $1.8 trillion, was the largest in history, a sign that public investors have an appetite for innovative private companies and a positive signal for private markets broadly. Under current conditions, we believe the window is open for select issuers: so far in 2026, IPOs have made up 9% of PE- and VC-backed exits by count but 59% of exit value. Of note, an IPO is not an immediate liquidity event for existing investors due to lock-ups. We expect most private companies to keep relying on exits outside the public market.
PE Exits Globally Continue to Recover, and Secondaries Have Become a Consistent Source of Liquidity
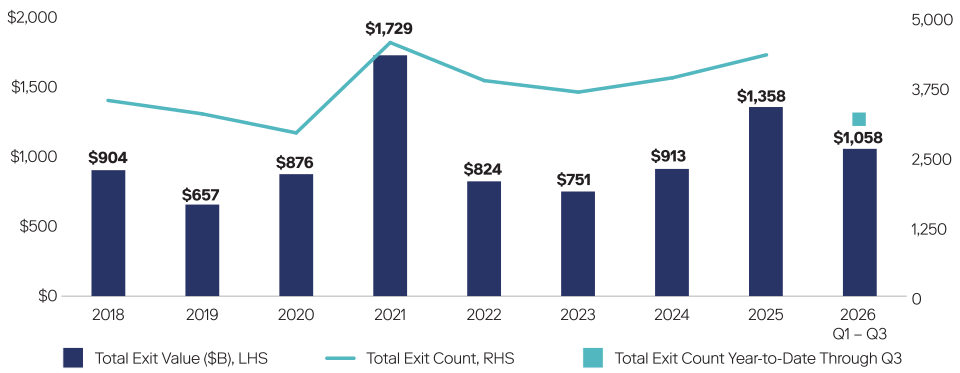
Global Private Equity-Backed Exits
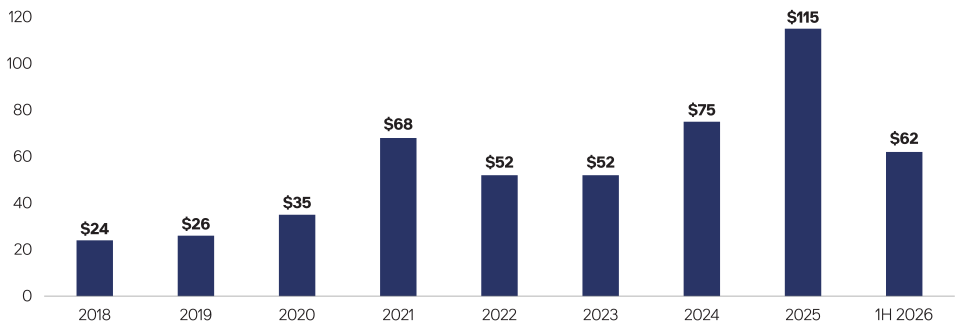
Global GP-Led Secondary Transaction Volumes ($B)
Source: Left: PitchBook as of Q3 2026. Right: Jefferies as of Q2 2026.
Note: The data for Q4 2025 and Q1-Q3 2026 is estimated.
We believe exit activity has been stronger than negative headlines suggest. In 2025, more than 4,000 companies exited at a combined value of $1.4 trillion, and estimated year-to-date totals through the third quarter of 2026 point to a similar pace.
Still, a large backlog of aging portfolio companies remains. GP-led secondaries have become a growing source of liquidity and continue to gain share, reaching a record $115 billion in 2025 as managers seek to extend ownership of high-conviction assets and return capital to LPs. We expect exit activity to continue to rise, and GP-led secondaries will play a growing role in broader portfolio construction.
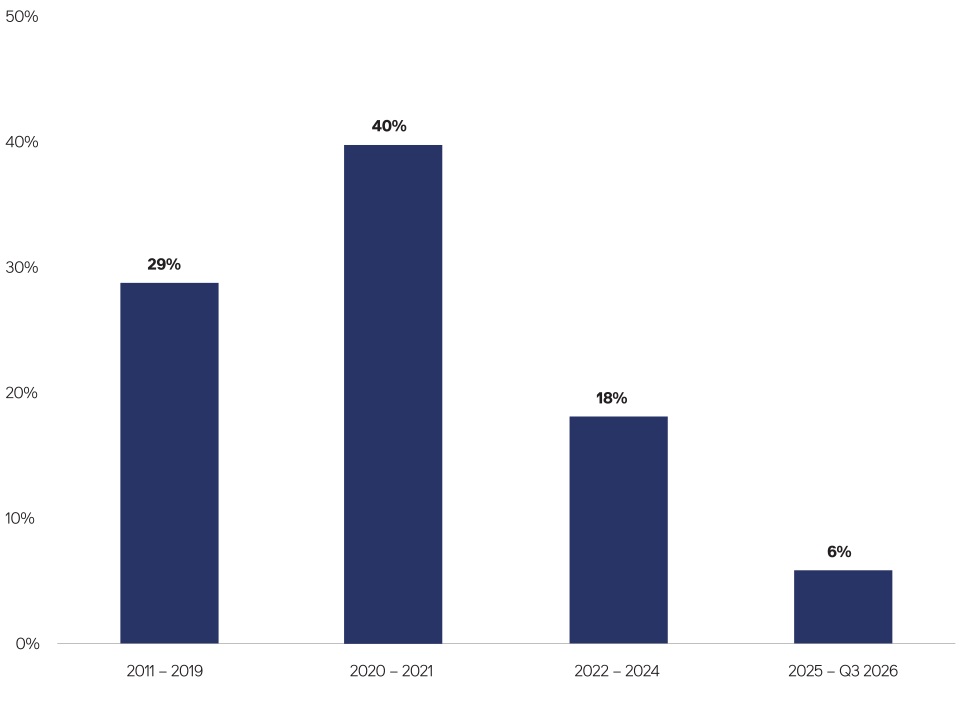
Exit Uplift Has Stayed Positive Through Every Market Cycle
Median Uplift Over Carrying Value 2 Quarters Prior to the Signing Date for an Exit
Source: Neuberger portfolio analytics and reporting as of Q3 2026.
Note: Excludes partial sales, write-offs, minority sell-downs, IPOs, buybacks, recapitalizations and debt repayment. The exits included in this universe represent approximately two-thirds of all buyout exit types in our proprietary database as of Q3 2026. The analysis includes ~1,250 full exits, and the uplift is represented by the return at exit compared to two quarters prior.
We analyzed full exits where we have direct access to the underlying data, a proprietary universe that covers about two-thirds of the buyout exits in our database.
We found that the exit uplift, the difference between an asset's sale price and its recent carrying value, has been positive in every period. The size of the uplift has fluctuated: ~30% pre-2020, peaking around 40% in 2020–2021, and narrowing since.
We believe this indicates that private equity marks are closer to expected exit values than they were in prior periods.