EM Corporate Earnings Momentum at its Strongest in Years
EBITDA Growth - EM Corporate Debt
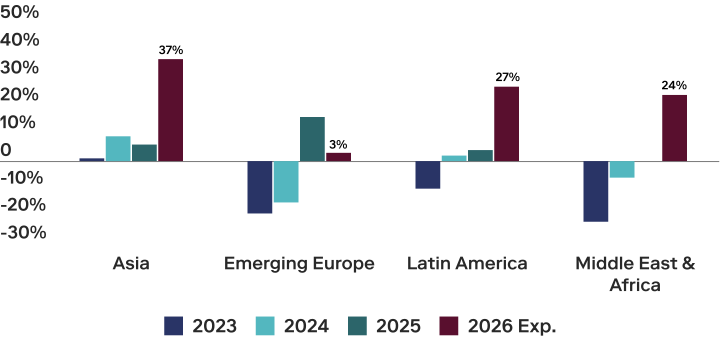
Source: J.P. Morgan, as of 26 June 2026, Bloomberg Finance L.P., CapitalIQ. Based on the EM corporate bond universe tracked by J.P.Morgan. 2026 expected EBITDA is based on Bloomberg consensus estimates compiled by J.P. Morgan. Note: Metrics exclude 100% quasi-sovereigns, financials and real estate companies.
- Earnings momentum for EM corporate debt issuers is at its strongest since 2021, with overall EBITDA expected to grow by 31% this year, and by 15% for the median issuer.
- Notably, all benchmark sectors and regions are expected to post positive EBITDA growth, led by larger companies in the technology sector which benefit from AI capex and by issuers in commodities sectors. The recent US-Iran ceasefire and resilient EM macro backdrop are expected to reinforce this trend going forward.
- We expect this improving earnings data to allow for some deleveraging of EM corporate balance sheets in the coming year, as long as capex does not increase materially, which should support credit rating upgrades.
EM Corporate Credit Fundamentals
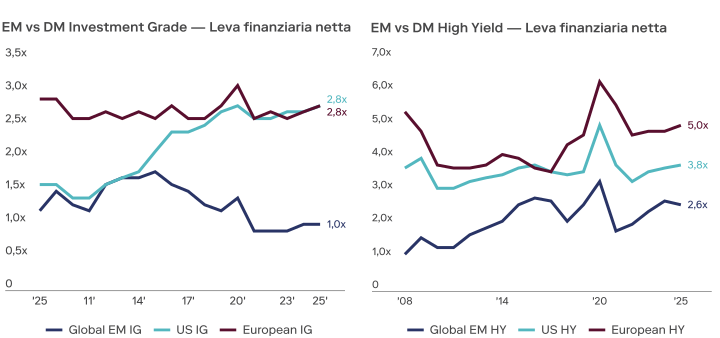
As of December 31, 2025. Source: J.P. Morgan, Bloomberg Finance L.P., CapitalIQ. Based on the EM corporate HY and IG bond universes, and the US and European HY and IG bond universes tracked by J.P.Morgan. Note: Excluding 100%-quasis, financials, real estate, and defaulted companies. 2022 and afterwards additionally excludes Russian corporates. DM numbers are as of 4Q25. EM results are based on partial 4Q25 earnings (270+ companies) blended with earlier results for those that did not report. For illustrative and discussion purposes only.
- The starting point for EM Corporate debt levels looks solid with Net Leverage at below average levels and well below similarly rated developed market credits.
- While spread levels are at historically tight levels across all major global credit markets, EM corporate debt continues to offer a spread pickup between 10 – 40bps across IG, BB and B rated segments compared to similar US credit buckets – with typically shorter duration.
- We expect EM credit spreads to stay compressed in the coming period given strengthening credit fundamentals and limited net issuance, with asset class returns driven primarily by carry and income.