Share of S&P 500 buybacks: Financials, AI Capex Spenders and Receivers
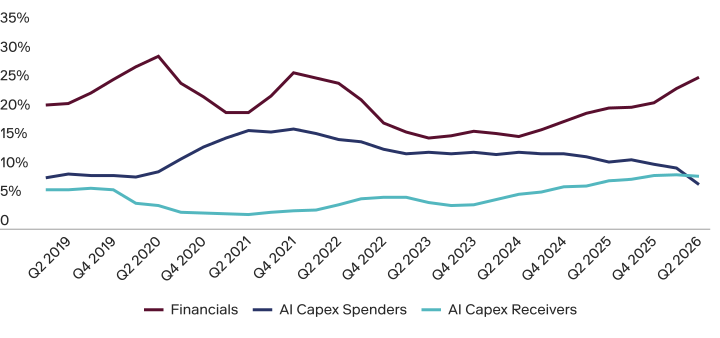
Source: Bloomberg, Neuberger analysis. As of 30 June 2026. % of trailing 12-month S&P 500 gross buybacks. Chart plots Q1 2019 to Q2 2026.
- S&P 500 companies repurchased $1.10 trillion of their own stock in the twelve months to June 2026, an all-time high.
- Within the AI complex, behavior is notably diverging between the capex spenders and the capex receivers. The AI spenders group cut buybacks 32% to $85 billion as their capital intensity has increased, while the receivers lifted theirs 12% to $100 billion. Yet the technology sector at large still reached a record $301 billion, with at least three-quarters of the $41.3 million increase coming from outside both AI capex groups, indicating a broadening within the sector.
- Financials increased buybacks more than any other sector, reaching a trailing-12-month record of $287 billion, as lighter capital requirements and strong capital-markets earnings freed up funds to return to shareholders.
- Communication services recorded the largest drop, down $53 billion, reflecting the reduction in activity from key hyperscalers. Activity also dropped among energy, consumer staples and consumer discretionary sectors as commodity prices and consumer cashflows softened.
Change in Trailing 12-month Buybacks Over the Last Year
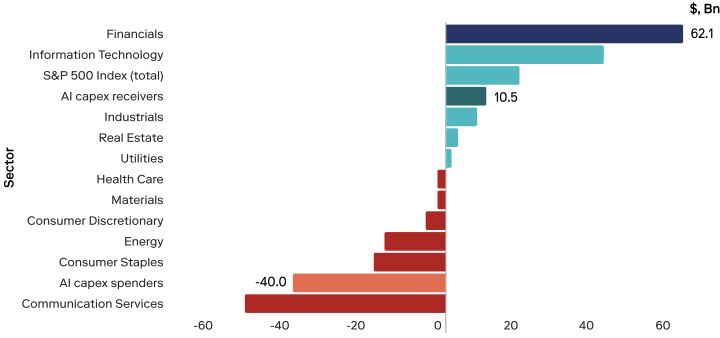
Source: Bloomberg, Neuberger analysis. As of 30 June 2026. LTM to Q2 2025 vs LTM to Q2 2026. Spenders and receivers cut across GICS sectors and are not additive with them.
The data has three clear implications for equity investors.
- First, the float-shrink tailwind is fading from the most heavily weighted companies in the index, removing a mechanical support to index-level EPS.
- Second, support is broadening downwards; more companies are now reducing share count than a year ago, which favours the equal-weighted index over the cap-weighted index.
- Finally, the marginal buyer of U.S. equities is now more cyclical and more credit-sensitive. Buybacks funded by hyperscaler free cash flow were close to unconditional. Buybacks funded by bank capital-return plans are not. Broad support for the market from buybacks remains solid, but it has become far more procyclical and exposed to potential weakness.