Back in December, the stock market balked when two-year and five-year Treasury yields “inverted”—in other words, shorter bond yields moved higher than their medium-term counterparts. Particularly nervous about economic slowing, some commentators pointed to the inversion in that portion of the yield curve as a sign that recession might be on the horizon.
In subsequent months, the two- and five-year curve generally stayed flat to slightly inverted while the positive slope between shorter- and longer-term yields became modestly steeper. However, on March 22, the three-month/10-year curve caused renewed concern when it became inverted by a few basis points before back moving to back to near-flat positioning more recently. Overall, the yield curve remains about flat, suggesting that we might be only a sharp market move or two away from a broader inversion. Would that be significant? It depends, as explained below.
Road to Inversion
As many investors know, the yield curve is typically positive, with yields increasing as you move out from shorter- to longer-maturity securities. Investors require greater returns on longer-maturity debt because they are risking their assets over an extended timeframe. When economic prospects are good, that typically implies higher future inflation, which is reflected in higher long-term bond yields. In contrast, when economic weakness is anticipated, that will usually reduce projected inflation and by extension long-term yields. Investors may compound this dynamic by purchasing long-term bonds to lock in higher yields before they are reduced any further.
The role of the Federal Reserve in the shape of the yield curve can be important. By forcing up its short-term fed funds rate, the Fed has the ability to cool inflationary expansion. So, just as short rates may be moving up due to policy, long rates may gradually come down, reflecting the potential success of the tightening. Together, these forces can move the yield seesaw from positive to flat to inverted.
The Yield Curve as Economic GPS
Does yield-curve inversion necessarily mean looming recession? Before addressing that question, it’s important to focus on the appropriate inversion measure. The two- and five-year yield relationship that investors were talking about in December hasn’t historically been the best leading indicator of recession potential. According to the San Francisco Federal Reserve, the two-year/10-year and (especially) the three-month/10-year Treasury curves have been better; unlike the two-year/five-year curve, both were in slightly positive territory two months ago and, aside from the recent movement in the three-month/10-year, have remained that way.
However, let’s assume for argument’s sake that the three-month/10-year curve turns negative for a longer timeframe. As shown below, such an inversion appeared prior to the last seven recessions—an impressive record—although on two occasions, yield curve inversion was actually a false positive and an imminent recession did not follow.
Yield Curve Inversion Has Often—but Not Always—Anticipated Recession
Spread Between 3-month and 10-Year U.S. Treasury Yields

Source: JPMorgan, Bloomberg.
For illustrative purposes only. Nothing herein constitutes a prediction of future market or economic environments. Due to a variety of factors, actual events, including the characteristic of economic or market environments may vary significantly from any historical trends or any views expressed. Investing entails risks, including possible loss of principal. Past performance is no guarantee of future results.
Today, there’s reason to believe that yield inversion could be a potentially less reliable leading indicator than in the past due to the Fed’s quantitative easing program. In the years following the global financial crisis, the Fed purchased longer-term bonds to drive down their yields. This encouraged a less restrictive lending market and stimulated economic growth while also improving liquidity and stability in the securities markets. As a result, long yields have been artificially low (reducing the so-called term premium for longer bonds), even as the Fed has raised short-term rates. This has artificially flattened the yield curve and increased the odds of an inversion. Given the lower term premium, the Richmond Federal Reserve says there is currently a 46% probability of inversion in any given month, compared to 10% when the term premium was at its historical average.1
It’s also worth noting that the globalization of the bond market has contributed new influences on long bond yields, including actions by non-U.S. central banks and supply/demand shifts tied to non-U.S. investors. A potential inversion might be a sign that the economy is slowing, but it could also indicate that non-U.S. investors are looking for a premium relative to still-unattractive yields in other countries.
Recession: When Do We Get There?
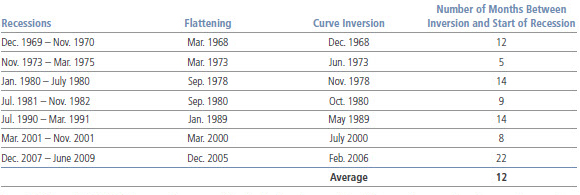
Given what we know about the shape of the yield curve and economic weakening, let’s make another assumption: that the recent three-month/10-year curve inversion does not turn out to be a false positive. In that case, how long might it take before the U.S. falls into a recession? A look at history suggests that the timeframe has typically been rather extended—an average of a year from inversion, but ranging from five to 22 months since the 1960s.
Travel Time: From Flattening to Inversion to Recession
Three-Month/10-Year U.S. Treasury Yield (Period: 1962 to Present)

Source: BCA Research. For illustrative purposes only. Nothing herein constitutes a prediction of future market or economic environments. Due to a variety of factors, actual events, including the characteristic of economic or market environments, may vary significantly from any historical trends or any views expressed. Investing entails risks, including possible loss of principal. Past performance is no guarantee of future results.
Considerations for Equities
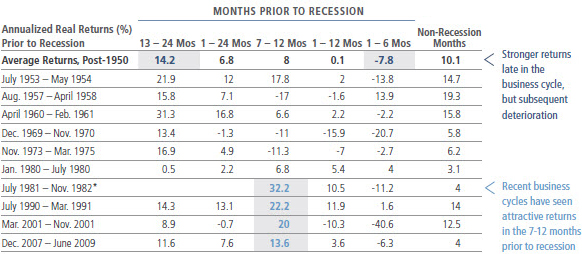
Clearly, anticipation of recession can have a major impact on equity prices. Gloom over economic growth contributed to the December market swoon and economic weakness continues to be a concern today. Stocks are also considered a leading indicator, often showing price deterioration in advance of the downturn. But how soon might that decline occur? And what could happen to stocks in the run-up to that inflection point? Another look at history can provide some perspective. As shown in the table below, in the late stages of the business cycle (or within a year or two of recession), equity returns have tended to be quite strong. This was when economic activity and corporate earnings also remained robust.
As you get closer to recession, the record has been more mixed. For many years, the seven to 12 months prior to an economic downturn were generally flat to down for the equity markets. However, these periods have been strongly positive in the last four business cycles. Closer to recession, the results have often been poor, and investing in equities in the six months prior to recession has typically involved paper losses.
Approaching Recession: The Road Gets Rougher

Source: BCA Research. Period: 1962 to present. For illustrative purposes only. Nothing herein constitutes a prediction of future market or economic environments. Due to a variety of factors, actual events, including the characteristic of economic or market environments, may vary significantly from any historical trends or any views expressed. Investing entails risks, including possible loss of principal. Past performance is no guarantee of future results.
The Road Ahead
What should you make of all the points above? To recap: It’s important to look at the most relevant portion of the U.S. Treasury yield curve; and you should understand that curve inversion isn’t a perfect leading indicator of recession, especially with distortions due to recent monetary policy. Moreover, even if the yield curve does anticipate a recession, it has often taken considerable time before that economic downturn is reached—potentially leaving room for stocks to show late-cycle performance strength.
In the current environment, our Asset Allocation Committee believes that the U.S. economy could experience a soft landing this year, with roughly 2.0% annualized GDP growth. At the same time, stocks have seen a nice recovery since their December lows, arguably reducing their short- to intermediate-term return potential. Still, it’s important to not become overly pessimistic based on one or two isolated leading technical indicators. Although the shape of the yield curve may provide some useful information, you should look at a broad range of conditions before reaching any conclusions about the potential direction of the economy or the markets.


