A lot of people are worried about inflation—or at least convinced that it has gone missing-in-action across the world. That concern came to a head during 2017, expressed in different ways by economists, central bankers, policymakers and financial markets.
In particular, many commentators point to the Phillips Curve—an economic model that is supposed to describe the inverse relationships between the rate of unemployment and the rate of inflation—and suggest that it no longer captures the reality.
Since 2009, unemployment in the OECD economies has declined from 8.5% to less than 6%. Japan’s rate has collapsed from 5.5% to less than 3%, a level unseen since the early 1990s. In the U.S., unemployment peaked at 10% and is now closing on the 4% threshold. Even in the Eurozone, where a second crisis pushed unemployment up beyond 12% in 2013, it has already fallen by a third. For all that, International Monetary Fund data suggests that global wage growth has remained stuck around 2% per annum, and consumer price inflation has actually fallen, from a peak of 5% in 2011 to around 1.5% in 2015-16. In the U.S., Core CPI has struggled to stay above 1.5%, and plunged again in the months following March 2017.
Janet Yellen, the current Chair of the U.S. Federal Reserve, is not alone among central bankers in worrying about this “mystery”. “Our framework for understanding inflation dynamics could be mis-specified in some fundamental way,” she said in September. Around the same time, at the Official Monetary and Financial Institutions Forum, Claudio Borio, Chief Economist at the Bank for International Settlements, asked his audience: “How much do we really know about the inflation process?”
In the meantime, central bankers have decided to press ahead with normalization of monetary policy, beginning with the gradual reduction of the $13 trillion worth of assets sitting on the balance sheets of the Fed, the European Central Bank and the Bank of Japan. That appears to have influenced the financial markets’ inflation expectations, from the low yields on nominal bonds and low or even negative yields on inflation-linked bonds, to the elevated price-to-earnings ratios prevalent in equity markets. At best, markets now consider the 2% level to be a ceiling for central bank inflation targeting. At worst, they suspect that a steady rate of inflation is no longer a central bank target at all.
In this paper we examine a number of questions that are raised by these observations.
- Is inflation really as abnormally low as all the commentary suggests?
- Are there structural developments in the global economy that might be disinflationary?
- Has the Phillips Curve really changed shape over recent years?
- Where might we look for leading indicators of incipient rising inflation?
- And how might investors position if they expect a return to rising inflation?
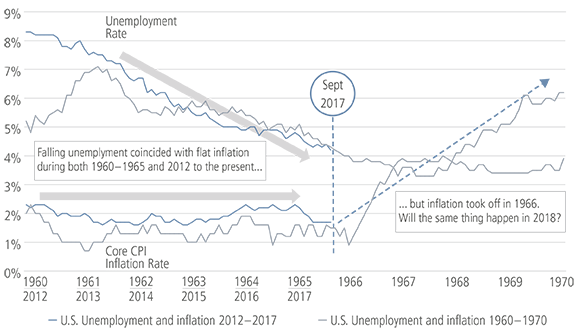
We saw the same movie in the 1960s
U.S. Unemployment and inflation, 1960-1970 and 2012-2017

Source: Neuberger Berman, Bureau of Labor Statistics. The chart shows the unemployment and inflation rates for
1960-1970, as well as the same rates between 2012 and 2017 backdated by 52 years.


