After a nearly two-decade trend upward1, fixed income prices have been volatile in 2015, though flattish performance through early August for many government bond markets has largely masked the turbulence. Now, with the prospect of higher interest rates gaining increasing clarity, market observers are dusting off a question often asked in recent years: Are bond markets about to correct and, if so, how painful will the implications be for them and other asset classes?
While history is filled with examples of corrections and even crashes that, in retrospect, pundits were able to dissect and link to multiple warning signs, what still remain elusive are tools that can be used effectively on a real-time or even preventative basis to navigate such tumultuous times. In other words, much like meerkats on sentry duty watching for the smallest signs of trouble, are there any such “guards” that can be used in the financial markets to indicate trouble ahead, whether in bonds or other asset classes?
As investors who navigate global asset classes across developed and emerging markets, we are careful not to look at one asset or region in isolation. If the global financial crisis taught us anything, it is that correlations can “go to one” quicker than imagined and assets that supposedly belong to one asset class can act very much like other asset classes.
Seeing the Danger Signs—Systematically
Given the importance of a comprehensive understanding of risk, our team has developed a number of tools to monitor these relationships across the global financial markets. Among other things, they currently show increased tightness in the relationship between bond markets and other asset classes.
This suggests to us that standard risk models may be currently underestimating the true market risks as they may be overly reliant on historical conditions which would suggest low volatility and negative correlation.
These tools are based on information theory and help to both measure and—importantly—to visualize systemic risk. In turn, we believe they can be used in asset allocation and to enhance diversification. We think these tools and what they show may also have implications for asset prices over the long term.
Systemic risk monitors are nothing new and attempts at developing such models range from the simplistic, such as the VIX Index, to more complicated models, such as the St. Louis Fed Financial Stress Index and the Philadelphia Fed’s Aruoba-Diebold-Scotti Business Conditions Index, among countless others. We seek to be more comprehensive—spanning the major asset classes and regions worldwide. Our goal is to have tools that are both tangible and not too abstract, with the ability to visualize this risk being a key objective.
Our approach to measuring and categorizing systemic risk is threefold:
- We develop a distance measure of how in sync any given asset is with all others; this is based on something called “mutual information,” a measure that is a close cousin of correlation but can take into account the fact that assets do not always follow linear relationships.
- We then calculate this measure for every pair of assets and graphically represent the essence of the resulting network of relationships—this is known as a spanning tree.
- We then define a measure called eccentricity, reflecting how unlike—that is, how eccentric—an asset is relative to other assets, or, potentially more unfortunately, how “central” an asset is, implying that a shock to that asset may have repercussions for a wide range of assets. All else being equal, we prefer high measures of eccentricity, which imply that assets are unlike other assets and thus a shock to one asset or region is not likely to have disastrous implications for the rest of the assets.
Although the technical jargon here may be difficult to conceptualize, anyone who has spent time at an airport under a clear blue sky, waiting out an inexplicable weather delay, has experienced these concepts firsthand. While you may have been flying out of Charleston, which had no weather issues, the plane you were waiting for may have been flying out of a hub city like New York, where summer thunderstorms were wreaking havoc. This is an example of a network with low eccentricity—bad weather in New York, a central hub, will likely affect flights up and down the eastern seaboard and beyond. Said another way, spanning trees are a little like quantitative divining rods that we use to examine the data and relationships in an effort to determine what the market seems most concerned about.
A look at the 2008-2009 financial crisis provides further clarity.
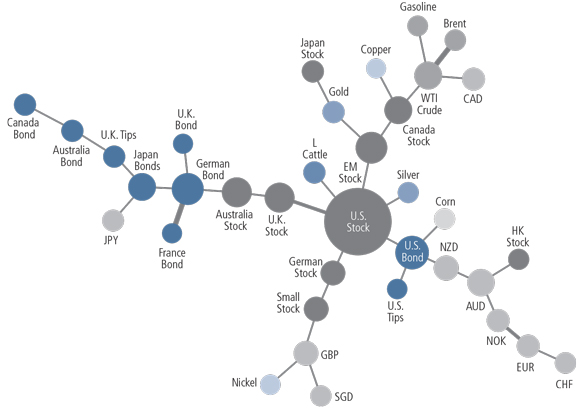
Figure 1: Spanning Tree as of September 2008

Source: Neuberger Berman, Bloomberg.
During the crisis, U.S. stocks were “located” in the middle of the network of financial assets, with a close relationship to emerging markets and crude oil. While there are multiple explanations for this similarity, all three assets are in some ways considered proxies for global growth, which was in question at the time. As a result, the prospects for other assets and regions were in part determined by how closely linked they were to these central “nodes” of U.S. equities, emerging markets and certain energy commodities.
In a more general sense, assets that are identified as central to a particular network are those that the market is most worried about; as a result, changes to these assets are more likely to affect others. Thus, assets in the center pose the most potential for systemic risk and should be monitored closely for potential risk budgeting or portfolio allocation decisions.
Bonds as a Risk Focal Point
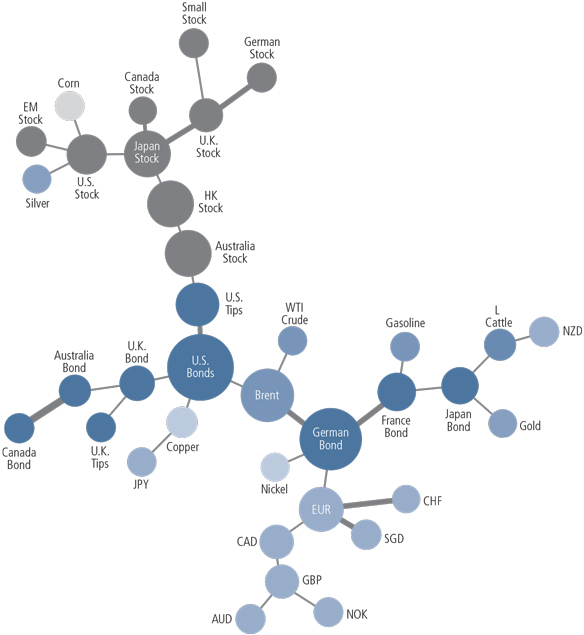
So what does the application of this framework portend, particularly for the global bond markets? As evident in the graph depicting today’s market relationships, bonds are at the center of the current network.
Figure 2: Spanning Tree as of July 2015

Source: Neuberger Berman, Bloomberg.
In our view, it makes sense that bonds have been moving to the middle of the system, given the tapering concerns in the U.S. as well as the uncertainty around the European Union, with bailouts coming at the expense of global balance sheets or driving currency depreciation. One interpretation of this is that bonds will be a source of concern as rates rise initially, but then might later become an opportunity once yields are high enough to attract income-seeking investors. We believe that spanning trees can help in identifying these opportunities and managing the risks accordingly.
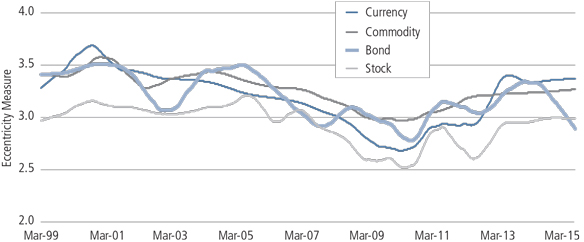
While the spanning tree of global assets provides a snapshot in time for the relationships between assets, we need some measure of how they have changed over time and how today’s position stacks up relative to history. Figure 3 shows, for each major asset class, how “eccentricity” has evolved over time. Recall that the more eccentric assets are, the less likely it is that shocks will reverberate throughout the system. However, a decline in eccentricity means that assets are moving closer together, which could create a more painful scenario in the event of a market correction.
Figure 3: Historical Eccentricity by Asset Class

Source: Neuberger Berman, Bloomberg.
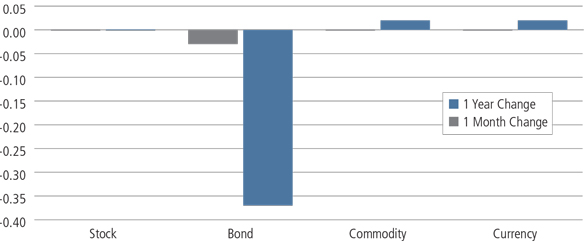
As can be seen in Figure 4, the eccentricity of global bonds has come down dramatically over the past year, although it remains above the lows plumbed in the post-crisis period. In fact, the change on a relative basis has been the most significant of the major asset classes.
Figure 4: Recent Changes in Eccentricity

Source: Neuberger Berman, Bloomberg.
Implications for Portfolio Management
What, then, are the implications of all of this for portfolio management? To begin, it is more challenging to find independent bets. Stocks and bonds are very central to the network, so the so the negative effects of incorrectly allocating capital may be magnified. A possible remedy for this is to seek diversification opportunities within an asset class. For example, in risk-based asset allocation portfolios, we currently favor including French bonds as a diversifier from German bonds, as the former are more on the outskirts of the network relative to their European counterpart. However, we are also more cautious now on bonds in general.
We are not saying that there currently is systemic risk on par with that of the global financial crisis, but we do think the use of custom, comprehensive risk monitoring tools can be helpful to see where problems may be developing so that investors can prepare accordingly. Spanning trees provide such a view of both risk and potential sources of volatility, using market relationships to identify the sources of systemic risk. The eccentricity measure furthers this concept to provide some historical context. Putting it all together, while there certainly is more variation and less tightness in these measures as compared to the 2008 period (when the networks had contracted sharply and were much tighter), we do believe this is something to keep an eye on in the coming weeks and months, particularly as we move toward an environment of higher interest rates.


